INVITE-ONLY SCRIPT
更新済 Tape Speed
Choose a long term averaging period (minutes) and a short term averaging period (seconds)
The indicator will begin loading ticks for the duration of the specified longer term averaging period.
ex: If the indicator is set to have a long term average of 10min, you must run the indicator for 10min first for it to begin its averaging process.
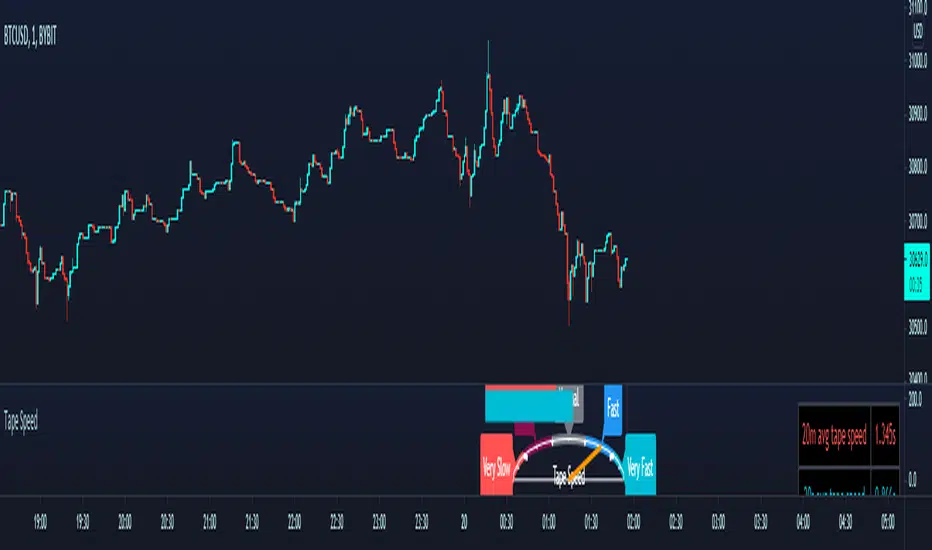
When the required duration of ticks have loaded, it will display the average time elapsed between each tick during that time.
It will also continue to read incoming ticks and calculate new averages once the initial load is finished.
The longer term average is displayed as a static red horizontal bar, the entire speedomter gauge, and the value is also explicitly stated in the top right corner with the table.
The blue bar, the needle, and the bottom row of the table are all representations of the shorter term period's average time between ticks.
The shorter term average is compared against the longer term average to determine whether the short term incoming orders are coming in more aggressively/less aggressively or normally compared to the longer period's average.
___________________________________________________________
Thanks to user rumpypumpydumpy for giving me permission to use his semicircle logic from his "Speedometer Toolbox" to display my own data.

The indicator will begin loading ticks for the duration of the specified longer term averaging period.
ex: If the indicator is set to have a long term average of 10min, you must run the indicator for 10min first for it to begin its averaging process.
When the required duration of ticks have loaded, it will display the average time elapsed between each tick during that time.
It will also continue to read incoming ticks and calculate new averages once the initial load is finished.
The longer term average is displayed as a static red horizontal bar, the entire speedomter gauge, and the value is also explicitly stated in the top right corner with the table.
The blue bar, the needle, and the bottom row of the table are all representations of the shorter term period's average time between ticks.
The shorter term average is compared against the longer term average to determine whether the short term incoming orders are coming in more aggressively/less aggressively or normally compared to the longer period's average.
___________________________________________________________
Thanks to user rumpypumpydumpy for giving me permission to use his semicircle logic from his "Speedometer Toolbox" to display my own data.
リリースノート
.招待専用スクリプト
このスクリプトは作者が承認したユーザーのみアクセス可能です。使用するにはアクセス申請をして許可を得る必要があります。通常は支払い後に承認されます。詳細は下記の作者の指示に従うか、Chonky_に直接お問い合わせください。
TradingViewは、作者を完全に信頼し、スクリプトの動作を理解していない限り、有料スクリプトの購入・使用を推奨しません。コミュニティスクリプトには無料のオープンソースの代替が多数あります。
作者の指示
DM me to beta test if you are familiar with Tape Speed/Pace of Tape from other platforms and use it often. I am looking for suggestions/improvements and need feedback.
免責事項
この情報および投稿は、TradingViewが提供または推奨する金融、投資、トレード、その他のアドバイスや推奨を意図するものではなく、それらを構成するものでもありません。詳細は利用規約をご覧ください。
招待専用スクリプト
このスクリプトは作者が承認したユーザーのみアクセス可能です。使用するにはアクセス申請をして許可を得る必要があります。通常は支払い後に承認されます。詳細は下記の作者の指示に従うか、Chonky_に直接お問い合わせください。
TradingViewは、作者を完全に信頼し、スクリプトの動作を理解していない限り、有料スクリプトの購入・使用を推奨しません。コミュニティスクリプトには無料のオープンソースの代替が多数あります。
作者の指示
DM me to beta test if you are familiar with Tape Speed/Pace of Tape from other platforms and use it often. I am looking for suggestions/improvements and need feedback.
免責事項
この情報および投稿は、TradingViewが提供または推奨する金融、投資、トレード、その他のアドバイスや推奨を意図するものではなく、それらを構成するものでもありません。詳細は利用規約をご覧ください。