INVITE-ONLY SCRIPT
Key Levels
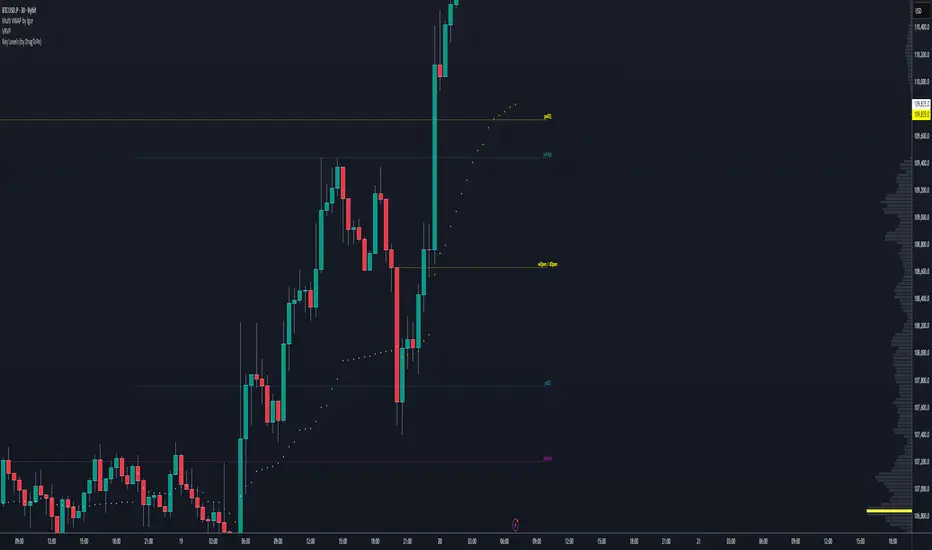
Key Levels automatically plots the most important price levels directly on your chart — giving you instant clarity on where the market is reacting.
What It Shows
Daily Levels:
Daily Open
Previous Day High & Low
Previous Day Equilibrium (Midpoint)
Weekly Levels:
Previous Week High & Low
Previous Week Equilibrium
Monthly Levels:
Previous Month High & Low
Previous Month Equilibrium
Yearly Levels:
Previous Year High & Low
Previous Year Equilibrium
Features
Fully customizable colors, styles, and line types
Option to toggle each timeframe on/off
Works on any symbol or timeframe
Lightweight and non-intrusive
💡 Why Use It
Easily identify areas where price is likely to react — such as liquidity pools, range extremes, and institutional levels. Perfect for day traders, swing traders, and smart money concept users.
招待専用スクリプト
こちらのスクリプトにアクセスできるのは投稿者が承認したユーザーだけです。投稿者にリクエストして使用許可を得る必要があります。通常の場合、支払い後に許可されます。詳細については、以下、作者の指示をお読みになるか、DragToPeに直接ご連絡ください。
スクリプトの機能を理解し、その作者を全面的に信頼しているのでなければ、お金を支払ってまでそのスクリプトを利用することをTradingViewとしては「非推奨」としています。コミュニティスクリプトの中で、その代わりとなる無料かつオープンソースのスクリプトを見つけられる可能性もあります。
作者の指示
Too good to be public.
Tom
免責事項
これらの情報および投稿は、TradingViewが提供または保証する金融、投資、取引、またはその他の種類のアドバイスや推奨を意図したものではなく、またそのようなものでもありません。詳しくは利用規約をご覧ください。