INVITE-ONLY SCRIPT
更新済 Support & Resistance - TradingED
The use of this indicator is restricted to private use, and it can be used only by invitation. Different functionalities have been added, such as alerts and signals that seek to make trading much easier to interpret by any type of trading operator of any experience level, from beginner to intermediate and advanced.
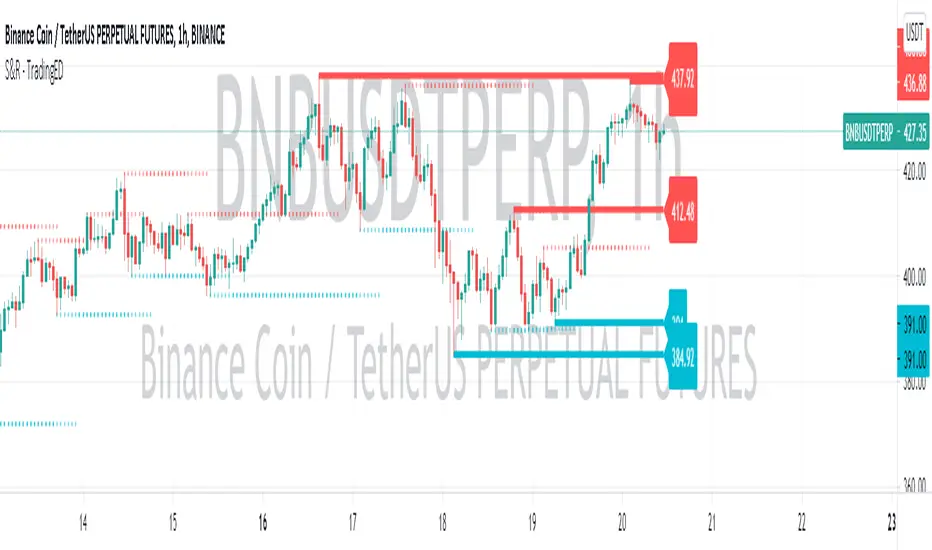
This indicator will help you identify support and resistance levels over a previously determined range, whether from a count by candles, by minutes, hours or days. These support and resistance levels are calculated thanks to the highest and lowest points that will be painted along the chart, from the levels that you have previously selected.
You will even have a way to identify the most recent levels, thanks to the fact that they will be painted in a darker tone, as well as some price labels to quickly identify each of the levels on the chart. Identifying these levels sometimes seems like a pretty difficult task, but with this indicator you will discover that it will be much easier than you think to be able to master these levels.
As part of the analysis of chart patterns, traders use these price levels on charts that tend to act as barriers, preventing the price of an asset from being pushed in a certain direction. Support and resistance levels serve to identify the points where the price can favor certain probabilities for a stagnation or reversal of a prevailing trend.
Main functions of this indicator:
1) The MEASURE can be based on a CANDLES count if you are trading OHLC Charts from 1D onwards, or if your trading is intraday, you can also select counts by MINUTES, HOURS or DAYS, depending on your trading style.
2) LENGTH, by default it will be loaded as in the STRATEGY, but considering the previous point, you can modify it according to your convenience.
3) You have the option to hide or show the EXTENDED LEVELS the way to identify the most recent levels.
4) You have the option to hide or show a LABEL at the right of the chart, with respect to the price levels.
Main functions to customize the style of this indicator:
a) You can select the COLOR for Support and for Resistance, with the colors that best suit you.
b) In the case of the LABELS that appear at the right, the text, type of label and default color is not modifiable.
リリースノート
Bug fixed!招待専用スクリプト
このスクリプトは作者が承認したユーザーのみアクセス可能です。使用するにはアクセス申請をして許可を得る必要があります。通常は支払い後に承認されます。詳細は下記の作者の指示に従うか、Trading_EDに直接お問い合わせください。
TradingViewは、作者を完全に信頼し、スクリプトの動作を理解していない限り、有料スクリプトの購入・使用を推奨しません。コミュニティスクリプトには無料のオープンソースの代替が多数あります。
作者の指示
Send DM
We are a community of Traders interested in applying adequate Risk Management for Financial Markets.
免責事項
この情報および投稿は、TradingViewが提供または推奨する金融、投資、トレード、その他のアドバイスや推奨を意図するものではなく、それらを構成するものでもありません。詳細は利用規約をご覧ください。
招待専用スクリプト
このスクリプトは作者が承認したユーザーのみアクセス可能です。使用するにはアクセス申請をして許可を得る必要があります。通常は支払い後に承認されます。詳細は下記の作者の指示に従うか、Trading_EDに直接お問い合わせください。
TradingViewは、作者を完全に信頼し、スクリプトの動作を理解していない限り、有料スクリプトの購入・使用を推奨しません。コミュニティスクリプトには無料のオープンソースの代替が多数あります。
作者の指示
Send DM
We are a community of Traders interested in applying adequate Risk Management for Financial Markets.
免責事項
この情報および投稿は、TradingViewが提供または推奨する金融、投資、トレード、その他のアドバイスや推奨を意図するものではなく、それらを構成するものでもありません。詳細は利用規約をご覧ください。