PROTECTED SOURCE SCRIPT
ICT Unicorn Model (DeadCat)
Overview
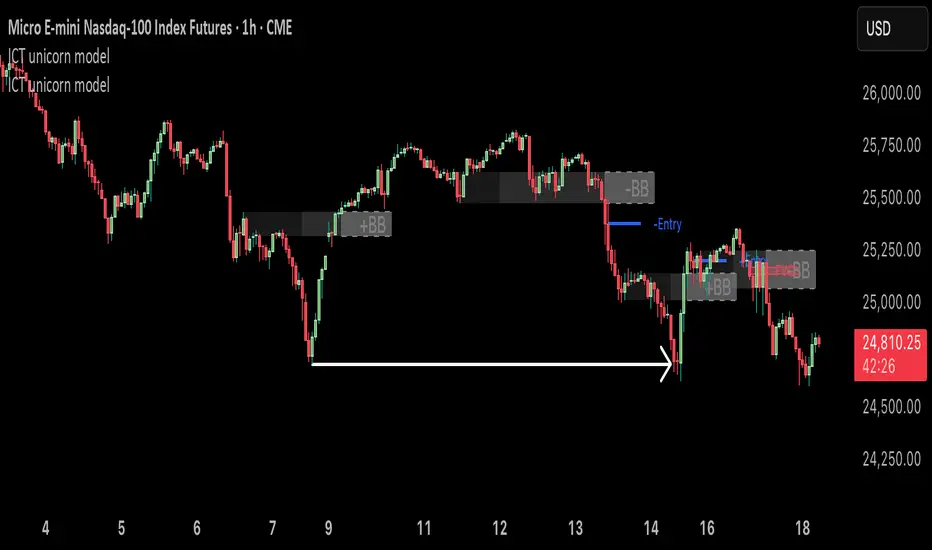
This indicator automatically identifies and visualizes ICT (Inner Circle Trader) Unicorn setups by detecting the confluence of Breaker Blocks (BB) and Fair Value Gaps (FVG). The ICT Unicorn setup occurs when a Breaker Block overlaps with a Fair Value Gap Fluxcharts, creating high-probability entry zones based on institutional order flow and price inefficiencies.
Core Concepts:
1. Market Structure Analysis
The script employs a swing-based market structure detection system that identifies:
Higher Highs (HH) and Higher Lows (HL) - Bullish market structure
Lower Highs (LH) and Lower Lows (LL) - Bearish market structure
This structure analysis uses a 20-period pivot detection system to identify key swing points and determine the prevailing market trend.
2. Order Block & Breaker Block Formation
When an order block fails and price breaks through it while creating a Fair Value Gap, it transforms into a Breaker Block Streetinvestment.
The script identifies this by:
Tracking the last opposing candle before a structural break
Detecting when price closes beyond the order block boundary
Supporting both single candle and consecutive candle modes for zone definition
Bullish Breaker Block: Forms when price breaks below a bullish order block, then rallies higher. The failed support zone becomes a new demand area.
Bearish Breaker Block: Forms when price breaks above a bearish order block, then falls lower. The failed resistance zone becomes a new supply area.
3. Fair Value Gap (FVG) Detection
A Fair Value Gap forms when price moves so rapidly that it creates a three-candle pattern where the high of the first candle does not overlap with the low of the third candle (bullish FVG) or the low of the first candle does not overlap with the high of the third candle (bearish FVG).
The indicator:
Identifies valid FVGs that overlap with the breaker block zone
Prioritizes the FVG closest to the extreme of the move (highest for bullish, lowest for bearish)
Filters FVGs that fall within the swing high/swing low range of the setup.
How The Indicator Works
Step 1: Structure Break Detection
The script continuously monitors market structure. When price breaks a swing high (bullish) or swing low (bearish), it enters "pending confirmation" mode requiring 2+ candles of the same color to confirm the structural shift.
Step 2: Order Block Identification
Upon structure confirmation, the indicator identifies the order block by locating the last opposing candle before the structural break. In consecutive candle mode, it extends the zone to include multiple same-colored candles.
Step 3: Breaker Block Formation
The order block transforms into a breaker block when:
Bullish BB: Price closes below the order block low
Bearish BB: Price closes above the order block high
Step 4: FVG Detection & Unicorn Confirmation
After breaker block formation, the script:
Scans for valid Fair Value Gaps within the swing range
Identifies overlapping FVGs with the breaker block
Confirms the Unicorn setup when both elements align
Creates visual markers (+BB/-BB and +FVG/-FVG labels)
Step 5: Dynamic Level Tracking
On the first candle after BB formation, the indicator tracks swing extremes (swing high for bullish, swing low for bearish) and locks this level after one bar, ensuring stable reference points.
Trading Application
Once price retraces to the fair value gap, traders can enter positions with stop loss placed beyond the breaker block and target a 1:2 risk-to-reward rati.
However, as noted in the warning message, taking all setups without higher timeframe bias or confluence is risky.
Recommended Usage:
- Use the Bias Filter to align with higher timeframe trends
- Combine with multi-timeframe analysis for context
- Wait for additional confirmation (volume, market session, news events)
- Consider implementing risk management rules (1-2% per trade)
Important Limitations
⚠️ Risk Disclosure: While these concepts offer valuable insights into institutional price action and trading setups, no strategy guarantees success, and trading carries significant risk of capital loss.
This indicator identifies mechanical setups without considering broader market context, fundamental factors, or higher timeframe bias.
The indicator shows ALL Unicorn formations based purely on technical structure, which means it will generate signals in both trending and ranging conditions. Traders must apply their own analysis to filter high-probability setups from low-probability ones.
保護スクリプト
このスクリプトのソースコードは非公開で投稿されています。 ただし、制限なく自由に使用できます – 詳細はこちらでご確認ください。
免責事項
この情報および投稿は、TradingViewが提供または推奨する金融、投資、トレード、その他のアドバイスや推奨を意図するものではなく、それらを構成するものでもありません。詳細は利用規約をご覧ください。
保護スクリプト
このスクリプトのソースコードは非公開で投稿されています。 ただし、制限なく自由に使用できます – 詳細はこちらでご確認ください。
免責事項
この情報および投稿は、TradingViewが提供または推奨する金融、投資、トレード、その他のアドバイスや推奨を意図するものではなく、それらを構成するものでもありません。詳細は利用規約をご覧ください。