PROTECTED SOURCE SCRIPT
Breakaway Gaps
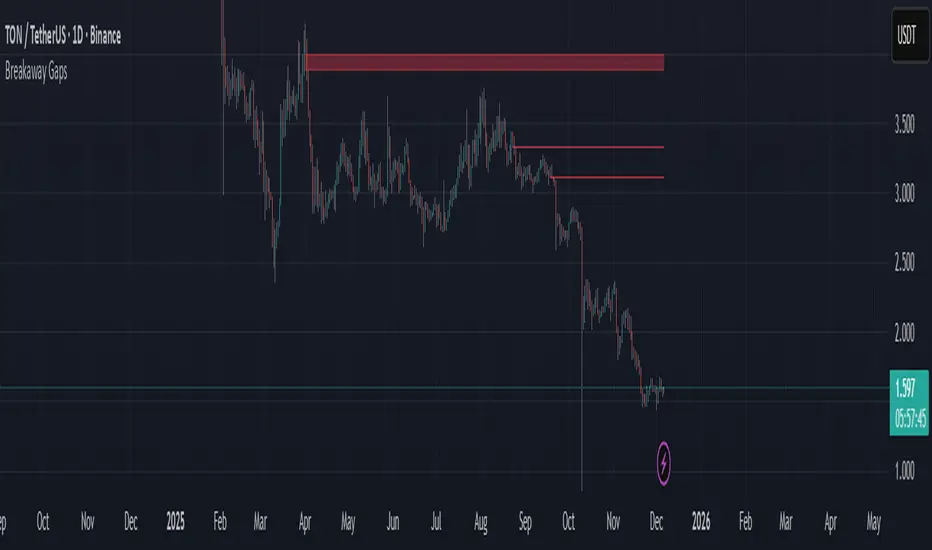
## Breakaway Gaps — Multi-Method Gap & Imbalance Mapping Tool
**Overview**
Breakaway Gaps is a gap-mapping tool designed to highlight areas where price has displaced rapidly and left potential imbalance zones on the chart. It blends multiple detection techniques into one framework, allowing traders to monitor different styles of “breakaway” behavior without clutter or manual drawing.
---
### What the script provides
- **Gap & imbalance zone detection** — identifies areas where price has moved quickly and may have left inefficiencies behind.
- **Breakaway zones** — highlights areas created by strong directional movement or structural shifts in price.
- **Automatic zone management** — highlighted areas extend forward and are removed once price interacts with them, keeping the chart clean.
- **Adjustable behavior** — all major parameters can be tuned: sensitivity, lookback length, displacement thresholds, color themes, and the number of displayed zones.
---
### Why this tool is useful
- Captures different forms of breakaway conditions in a single indicator.
- Helps traders visualize zones that may act as future reaction points, liquidity magnets, or reference areas.
- Designed to keep the chart clean by automatically maintaining and updating all zones.
- Flexible enough to support both discretionary and systematic styles.
---
### What it does *not* do
- Does **not** generate trade signals, entries, exits, stop levels, or position direction.
- Does not predict outcomes or guarantee that any highlighted zone will be respected or filled.
- Should be used as a contextual tool alongside your own analysis and risk management.
---
### Suggested applications
- Identifying potential retracement targets after strong moves
- Marking areas where liquidity may rest or where price may rebalance
- Supporting market structure, breakout, or liquidity-based trading frameworks
- Higher-timeframe context zones combined with lower-timeframe execution
---
### Customization
The tool offers full user control over sensitivity, zoning behavior, highlight style, and display limits, so traders can adapt it to different markets and timeframes.
---
**Disclaimer**
This tool is for chart visualization only. It does not provide financial advice or guaranteed outcomes. Always use proper risk management and your own judgment when trading.
保護スクリプト
このスクリプトのソースコードは非公開で投稿されています。 ただし、制限なく自由に使用できます – 詳細はこちらでご確認ください。
Doer
免責事項
この情報および投稿は、TradingViewが提供または推奨する金融、投資、トレード、その他のアドバイスや推奨を意図するものではなく、それらを構成するものでもありません。詳細は利用規約をご覧ください。
保護スクリプト
このスクリプトのソースコードは非公開で投稿されています。 ただし、制限なく自由に使用できます – 詳細はこちらでご確認ください。
免責事項
この情報および投稿は、TradingViewが提供または推奨する金融、投資、トレード、その他のアドバイスや推奨を意図するものではなく、それらを構成するものでもありません。詳細は利用規約をご覧ください。