PROTECTED SOURCE SCRIPT
更新済 Daily, Weekly, Monthly Pivot Points Standard
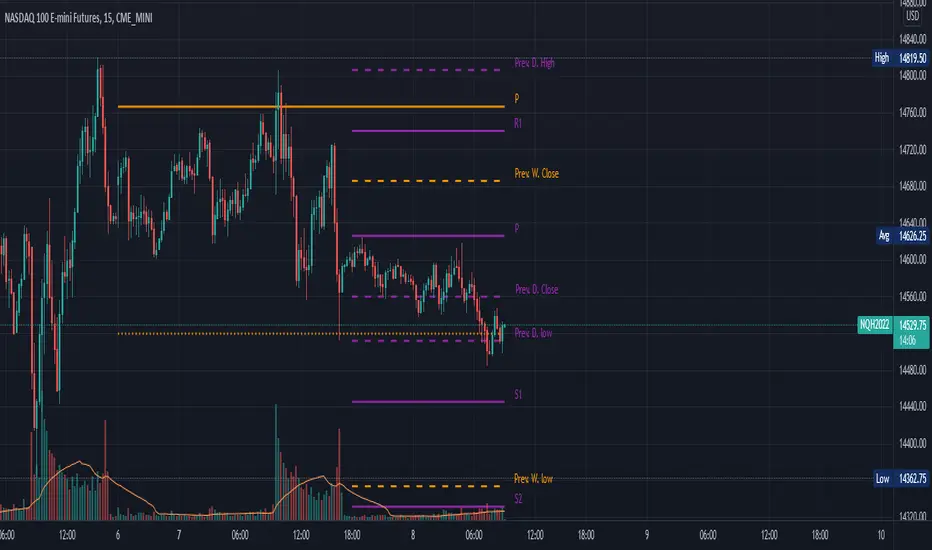
Show Higher timeframe Pivot Point along with 3 support/Resistance and mid line between them
Option to show the Monthly lines, with or without mid line, and can select the color
Option to show the Weekly lines, with or without mid line, and can select the color
Option to show the Daily lines, with or without mid line, and can select the color
Option to show a tables with the previous Open, High, Low, Close for these higher timeframe
リリースノート
Added Option to relocate the OHLC tableリリースノート
Added the OHLC lines instead of tableFixed the monthly line start for different exchange timezone
Price for lines are now shown on the right (where it's more useful to see it)
リリースノート
Update chartリリースノート
Added tooltipAdded HLC for all timeframe
リリースノート
Added option to show or not the price on linesリリースノート
Fixed a bug with the monthly lines not always working on different timeframeAdded Mid line for the Previous value (daily, weekly, monthly)
Added labels for the mid lines
Added tooltips
保護スクリプト
このスクリプトのソースコードは非公開で投稿されています。 ただし、制限なく自由に使用できます – 詳細はこちらでご確認ください。
免責事項
この情報および投稿は、TradingViewが提供または推奨する金融、投資、トレード、その他のアドバイスや推奨を意図するものではなく、それらを構成するものでもありません。詳細は利用規約をご覧ください。
免責事項
この情報および投稿は、TradingViewが提供または推奨する金融、投資、トレード、その他のアドバイスや推奨を意図するものではなく、それらを構成するものでもありません。詳細は利用規約をご覧ください。