PROTECTED SOURCE SCRIPT
更新済 RSI SR by Kred-Allino
Hello Trader,
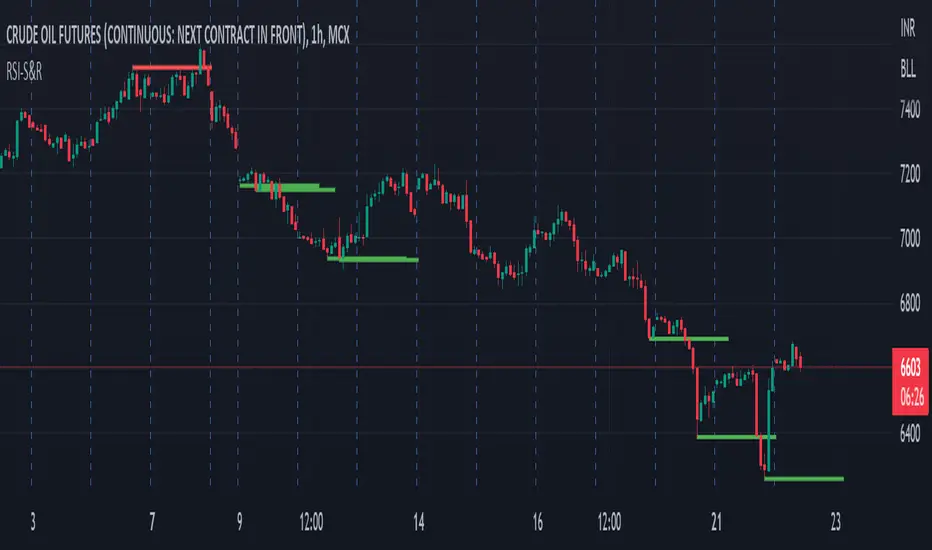
This indicator is draw Support & Resistance Level based on RSI Calculation, It will help you to find Support and Resistance very Easily.
Red Color Line - Resistance
Green Color Line - Support
RSI comes up from the OS region. So it's good time to do the calculation with.
- Find out the lowest RSI value from the RSI array
- Get the corresponding low price from the price array
- Get the corresponding bar_index from bar_index array
- Draw the demand/support line on that price
This Indicator is made for Educational Purpose only, Author will not liable for direct or indirect for any losses due to use of Indicator.
リリースノート
Color Changed保護スクリプト
このスクリプトのソースコードは非公開で投稿されています。 ただし、制限なく自由に使用できます – 詳細はこちらでご確認ください。
免責事項
この情報および投稿は、TradingViewが提供または推奨する金融、投資、トレード、その他のアドバイスや推奨を意図するものではなく、それらを構成するものでもありません。詳細は利用規約をご覧ください。
保護スクリプト
このスクリプトのソースコードは非公開で投稿されています。 ただし、制限なく自由に使用できます – 詳細はこちらでご確認ください。
免責事項
この情報および投稿は、TradingViewが提供または推奨する金融、投資、トレード、その他のアドバイスや推奨を意図するものではなく、それらを構成するものでもありません。詳細は利用規約をご覧ください。