INVITE-ONLY SCRIPT
更新済 Moonraker 1.3
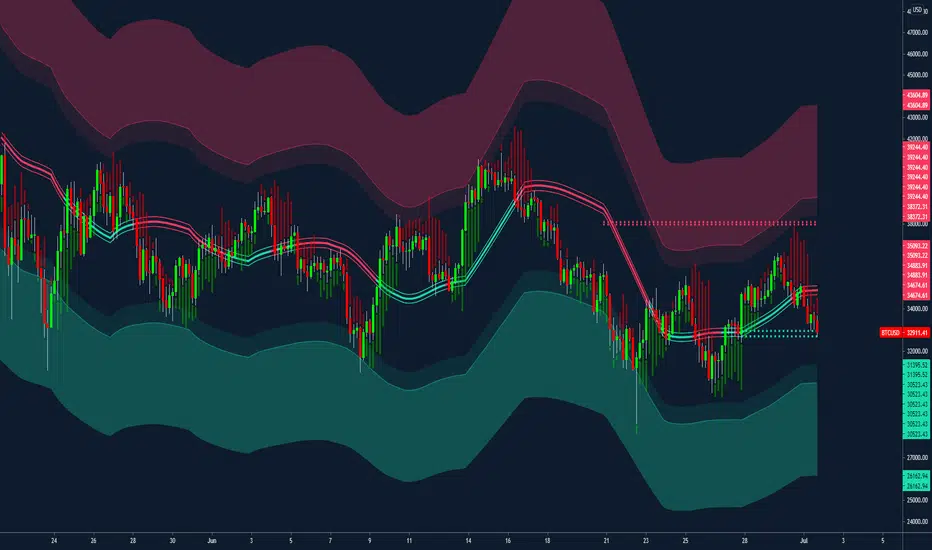
Bespoke Decentrader Mean Reversion Strategy
Colour coded mean line using price and volume
Volatility Bands
Major support and resistance plotted lines
Suggested dynamic hard stop placement
Built for all markets
A realistic strategy for multi-asset portfolio management
Complementary components to assist other indicators/strategies
Key D1 Strategy:
Designed for the 1D+ chart
The overall assumption is that price gravitates towards the mean
The intention is to remain in the market directionally as long as possible
1) Once the asset closes the period above the mean line the asset is considered to be bullish
2) Trader will wait and look to buy close to the developing mean line
3) Trader once filled, remains long
4) If price closes below the mean line, trader will place asks/sell orders close to the developing mean line
5) Trader moves asks along developing mean line until the trade is exited
6) Trader waits in a neutral position until condition 1) is met
Other strategy consideration ;
7) Support and resistance plotted lines can also be used to overrule condition 6) i.e. if the asset falls to a key support area AND trader has already exited, they can look to re-enter and be long to the mean line at which point condition 5) is met
8) Volatility bands can be used as a warning around the deviation from the mean line and probability of reversal
9) Hard stops can be used -> there is a general trade-off between volatility and remaining in the trade – Dynamic hard stops can be used if the trader wishes to add a layer of additional risk management to mitigate unusual volatile events. Should a stop be triggered, waiting for either condition 1) 7) or 8) are met before entering.
Other consideration;
- Works well alongside the Predator indicator; adding additional confluence to the strategy or identifying entries if predator is already within a trend where the initial entry was missed.
リリースノート
Updated to include an alert function for Crossing the Mean / Crossing the deviation bands.リリースノート
Updated to include:- Additional alerts from crossing upper and lower mean line band.
- Option to include Combined Bitcoin volume.
リリースノート
Added optional momentum indicator to add confluence for entires. Also, please be aware that i have been made aware of a bug in the alerts previously added to please just test them at the moment.
リリースノート
Updating to remove the other indicators from the chart or ill get into trouble off TV.リリースノート
REMOVED BTCPAX FROM CODE AS REMOVED FROM BINANCE - REMOVE AND RE ADD SCRIPTリリースノート
Volume Correctedリリースノート
Removed combined btc volume to improve load times. リリースノート
Updated to define each of the line/band conditions for better definitions when making alerts. 招待専用スクリプト
このスクリプトは作者が承認したユーザーのみアクセス可能です。使用するにはアクセス申請をして許可を得る必要があります。通常は支払い後に承認されます。詳細は下記の作者の指示に従うか、filbfilbに直接お問い合わせください。
TradingViewは、作者を完全に信頼し、スクリプトの動作を理解していない限り、有料スクリプトの購入・使用を推奨しません。コミュニティスクリプトには無料のオープンソースの代替が多数あります。
作者の指示
Access via decentrader.com as of 28th June 2021
免責事項
この情報および投稿は、TradingViewが提供または推奨する金融、投資、トレード、その他のアドバイスや推奨を意図するものではなく、それらを構成するものでもありません。詳細は利用規約をご覧ください。
招待専用スクリプト
このスクリプトは作者が承認したユーザーのみアクセス可能です。使用するにはアクセス申請をして許可を得る必要があります。通常は支払い後に承認されます。詳細は下記の作者の指示に従うか、filbfilbに直接お問い合わせください。
TradingViewは、作者を完全に信頼し、スクリプトの動作を理解していない限り、有料スクリプトの購入・使用を推奨しません。コミュニティスクリプトには無料のオープンソースの代替が多数あります。
作者の指示
Access via decentrader.com as of 28th June 2021
免責事項
この情報および投稿は、TradingViewが提供または推奨する金融、投資、トレード、その他のアドバイスや推奨を意図するものではなく、それらを構成するものでもありません。詳細は利用規約をご覧ください。