PROTECTED SOURCE SCRIPT
Absolute Range 1/2 - Histogram Style - Alternating 7 Bars
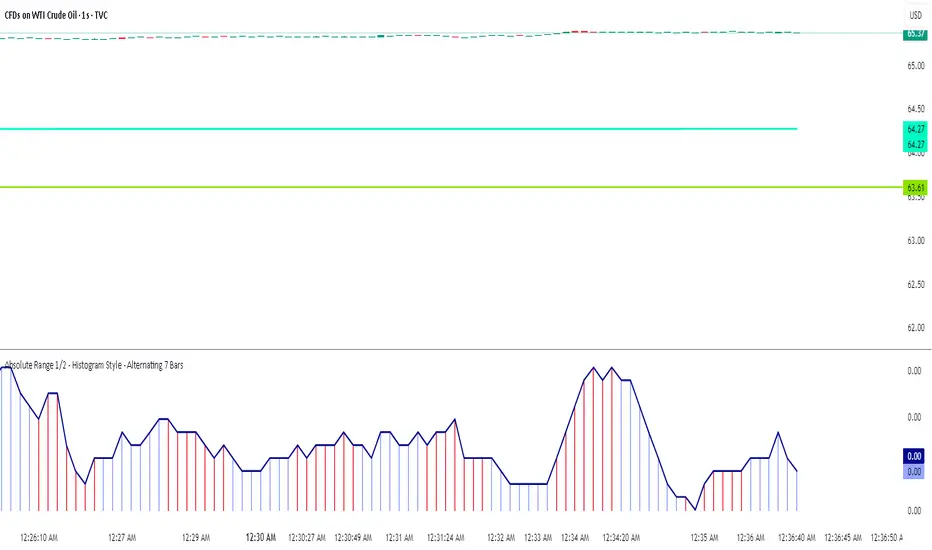
Absolute Range 1/2 - Histogram Style with Alternating 7-Bar Colors
This indicator calculates the 9-period simple moving average of the daily range (high minus low) and plots half of this value as a histogram and a line for easy visual tracking of range volatility.
To enhance readability, the histogram bars alternate colors every 7 bars — grouping the bars in blocks of seven with distinct colors. This makes it easier to observe range patterns and changes over time.
Features:
Smooths range data using SMA(9)
Plots half the average range as histogram bars and a line overlay
Alternates histogram bar colors every 7 bars dynamically
Clean, minimalistic design suitable for identifying volatility trends
保護スクリプト
このスクリプトのソースコードは非公開で投稿されています。 ただし、制限なく自由に使用できます – 詳細はこちらでご確認ください。
免責事項
この情報および投稿は、TradingViewが提供または推奨する金融、投資、トレード、その他のアドバイスや推奨を意図するものではなく、それらを構成するものでもありません。詳細は利用規約をご覧ください。
保護スクリプト
このスクリプトのソースコードは非公開で投稿されています。 ただし、制限なく自由に使用できます – 詳細はこちらでご確認ください。
免責事項
この情報および投稿は、TradingViewが提供または推奨する金融、投資、トレード、その他のアドバイスや推奨を意図するものではなく、それらを構成するものでもありません。詳細は利用規約をご覧ください。