OPEN-SOURCE SCRIPT
Multi-Timeframe Golden Cross_Raden (DCMS)
How the Script Works
The f_checkGoldenCross function:
Calculates the fast MA (50-day SMA) and slow MA (200-day SMA) for a given timeframe.
Returns true if a Golden Cross (fast MA crossing over slow MA upwards) occurs, false otherwise.
Detection per Timeframe:
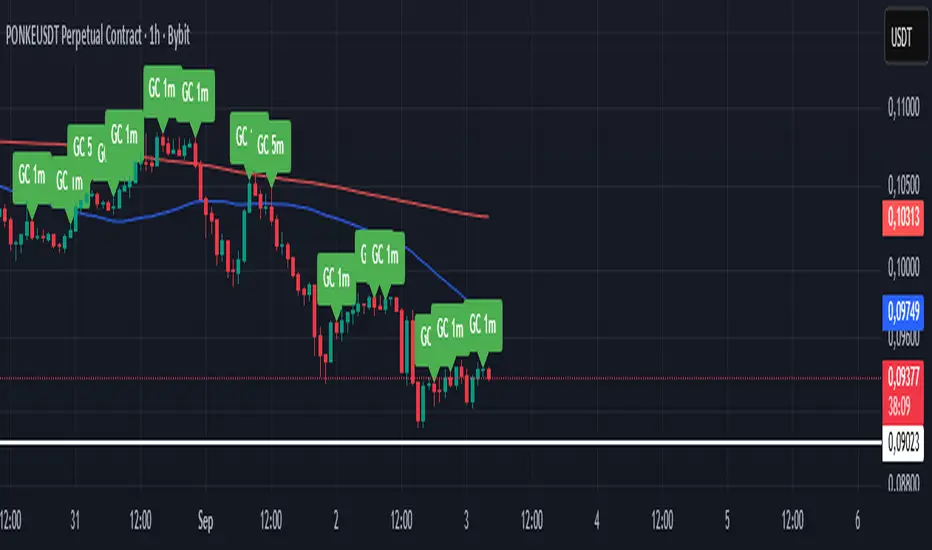
Golden Crosses are checked for 8 timeframes: 1m, 5m, 15m, 1h, 4h, D, W, M.
If a crossover occurs, a green label with the text "GC" + the timeframe appears above the candle.
Visualization:
The fast MA (blue) and slow MA (red) are plotted on the current timeframe chart.
The Golden Cross label appears for each timeframe that detects a crossover.
Alerts:
Automatic alerts for Golden Crosses on the current timeframe chart (via maFastCurrent and maSlowCurrent).
Additional alerts for each timeframe (1m, 5m, etc.) so you can set notifications separately in TradingView.
___---Important Notes---___
Historical Data: Ensure the chart has enough bars (at least 200 for the 200-day MA) on the higher timeframes (W, M). If there's not enough data, the Golden Cross on those timeframes won't be detected.
Performance: Since we're explicitly checking 8 timeframes, this script should be lighter than an array loop, but still performs well on charts with long data sets.
Customization: If you'd like to add filters (for example, volume or RSI to confirm the Golden Cross), let me know, and I'll add them!
Debugging: If the error persists, copy and paste the error message from PineScript Editor or a screenshot, and I'll help you troubleshoot.
The f_checkGoldenCross function:
Calculates the fast MA (50-day SMA) and slow MA (200-day SMA) for a given timeframe.
Returns true if a Golden Cross (fast MA crossing over slow MA upwards) occurs, false otherwise.
Detection per Timeframe:
Golden Crosses are checked for 8 timeframes: 1m, 5m, 15m, 1h, 4h, D, W, M.
If a crossover occurs, a green label with the text "GC" + the timeframe appears above the candle.
Visualization:
The fast MA (blue) and slow MA (red) are plotted on the current timeframe chart.
The Golden Cross label appears for each timeframe that detects a crossover.
Alerts:
Automatic alerts for Golden Crosses on the current timeframe chart (via maFastCurrent and maSlowCurrent).
Additional alerts for each timeframe (1m, 5m, etc.) so you can set notifications separately in TradingView.
___---Important Notes---___
Historical Data: Ensure the chart has enough bars (at least 200 for the 200-day MA) on the higher timeframes (W, M). If there's not enough data, the Golden Cross on those timeframes won't be detected.
Performance: Since we're explicitly checking 8 timeframes, this script should be lighter than an array loop, but still performs well on charts with long data sets.
Customization: If you'd like to add filters (for example, volume or RSI to confirm the Golden Cross), let me know, and I'll add them!
Debugging: If the error persists, copy and paste the error message from PineScript Editor or a screenshot, and I'll help you troubleshoot.
オープンソーススクリプト
TradingViewの精神に則り、この作者はスクリプトのソースコードを公開しているので、その内容を理解し検証することができます。作者に感謝です!無料でお使いいただけますが、このコードを投稿に再利用する際にはハウスルールに従うものとします。
免責事項
これらの情報および投稿は、TradingViewが提供または保証する金融、投資、取引、またはその他の種類のアドバイスや推奨を意図したものではなく、またそのようなものでもありません。詳しくは利用規約をご覧ください。
オープンソーススクリプト
TradingViewの精神に則り、この作者はスクリプトのソースコードを公開しているので、その内容を理解し検証することができます。作者に感謝です!無料でお使いいただけますが、このコードを投稿に再利用する際にはハウスルールに従うものとします。
免責事項
これらの情報および投稿は、TradingViewが提供または保証する金融、投資、取引、またはその他の種類のアドバイスや推奨を意図したものではなく、またそのようなものでもありません。詳しくは利用規約をご覧ください。