PROTECTED SOURCE SCRIPT
AOC Support & Resistance V1

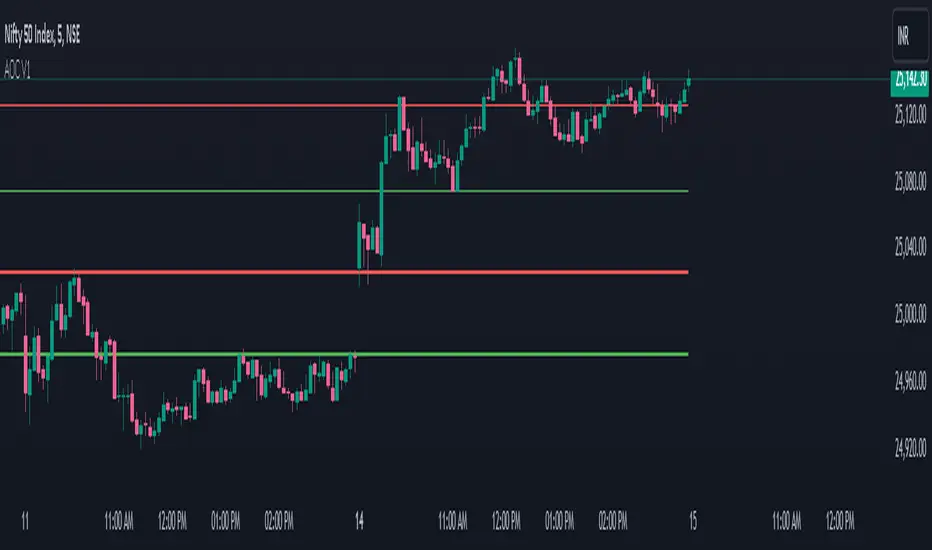
he AOC V1 indicator is designed to plot up to six customizable horizontal price levels on a chart with display options and label customization. This indicator is helpful for marking support (S1, S2, S3) and resistance (R1, R2, R3) levels, often used by traders to analyze market behavior.
Key Features:
Price Level Inputs: Six price levels (R1, S1, R2, S2, R3, S3) can be manually set. These levels are typically used as support and resistance levels.
Display On/Off Toggle: Each price level has an option to be toggled on or off, allowing the user to display only the relevant levels.
Custom Line Style: Users can adjust the color, width, and style (solid, dotted, or dashed) for each line to enhance the chart’s clarity and fit the user's preferences.
Label at Start of the Day: Each price level has a label that shows the price and is placed at the start of the trading day. This helps traders easily identify and track key price levels throughout the session.
Session Control: You can choose to draw the lines either for the entire chart or just for the current day’s trading session. This flexibility allows traders to focus on real-time price movements or broader trends.
Auto-Update: The lines are automatically updated as new bars are formed, ensuring that they stay anchored to the specified price levels.
Inputs:
R1, S1, R2, S2, R3, S3: The specific price levels for the resistance and support levels.
Line Color: Users can customize the line color for each level (Red for resistance levels and Green for support levels by default).
Line Width: The width of the horizontal lines, which can be adjusted from 1 to 5 pixels.
Line Style: The line style can be set to solid, dotted, or dashed, depending on user preference.
Display On/Off: Each level can be individually displayed or hidden by toggling the display option.
This indicator is highly customizable and designed to provide traders with easy-to-interpret visual cues for key price levels in the market.
保護スクリプト
このスクリプトのソースコードは非公開で投稿されています。 しかし、無料かつ制限なしでご利用いただけます ― 詳細についてはこちらをご覧ください。
免責事項
これらの情報および投稿は、TradingViewが提供または保証する金融、投資、取引、またはその他の種類のアドバイスや推奨を意図したものではなく、またそのようなものでもありません。詳しくは利用規約をご覧ください。
保護スクリプト
このスクリプトのソースコードは非公開で投稿されています。 しかし、無料かつ制限なしでご利用いただけます ― 詳細についてはこちらをご覧ください。
免責事項
これらの情報および投稿は、TradingViewが提供または保証する金融、投資、取引、またはその他の種類のアドバイスや推奨を意図したものではなく、またそのようなものでもありません。詳しくは利用規約をご覧ください。