PROTECTED SOURCE SCRIPT
MACD on Volume (Signal)
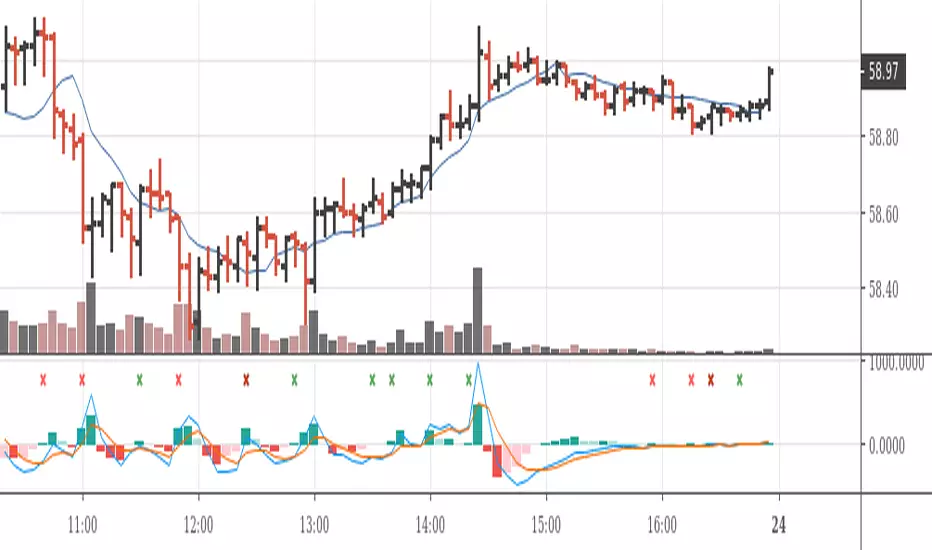
Volume-Price-based 5-min-Chart Trading
Pull up a 5-min chart of your favourite commodity future and stay inside regular trading hours, but show all of globex trading, too.
You will want to base your trading off the 5-min chart on volume and price.
Volume Logic:
The (positive) histogram of your MACD on Pro Rata Volume* indicates market phases with valuable participation. Participate in those phases. Put a horizontal ray on your volume indicator to indicate slow and less than slow volume phases. Stay away from those market phases.
*) Pro Rata Volume = Actual Volume * 300 / elapsed seconds
(Do the platform test. Can you add this indicator to your platform?)
保護スクリプト
このスクリプトのソースコードは非公開で投稿されています。 ただし、制限なく自由に使用できます – 詳細はこちらでご確認ください。
免責事項
この情報および投稿は、TradingViewが提供または推奨する金融、投資、トレード、その他のアドバイスや推奨を意図するものではなく、それらを構成するものでもありません。詳細は利用規約をご覧ください。
免責事項
この情報および投稿は、TradingViewが提供または推奨する金融、投資、トレード、その他のアドバイスや推奨を意図するものではなく、それらを構成するものでもありません。詳細は利用規約をご覧ください。