PROTECTED SOURCE SCRIPT
Khate ravand
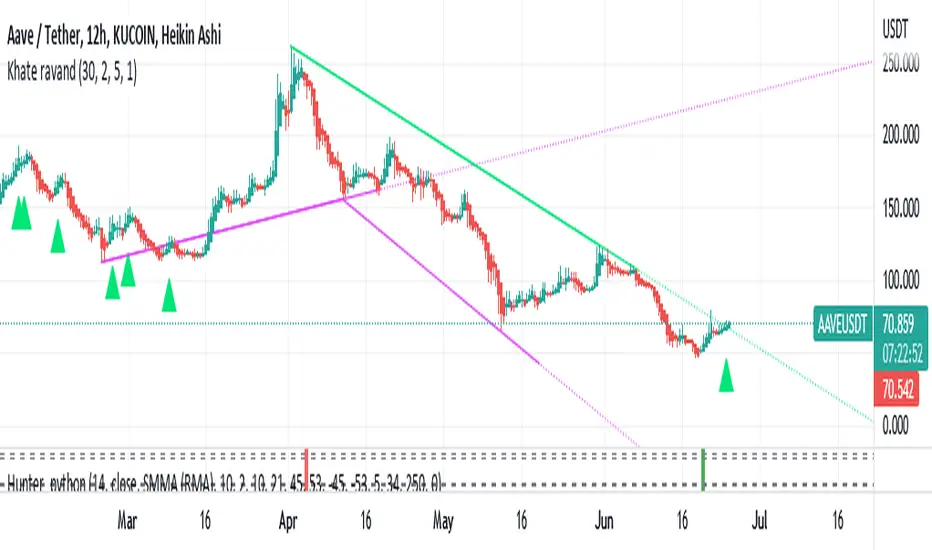
This script draws trendlines from the pivot points in the price chart.
//
// The input for the function that draws the trendlines is any calculation or function
// (here this is pivot points, but the core of the script can be used in other implementations too),
// that most of the time and occasionally produces a 'non n/a' value.
// The trendline function then connects the non n/a values and extends the connections of those points in a trendline.
//
// There is an option to draw the lines from the wicks or from the 'real bodies' of the candles.
// The trendlines can either extend infinitely or only run for an adjustable amount of bars.
//
// There's an option to display trendline breaks
// And the option to display trendlines in color or monochrome
//
//
// The input for the function that draws the trendlines is any calculation or function
// (here this is pivot points, but the core of the script can be used in other implementations too),
// that most of the time and occasionally produces a 'non n/a' value.
// The trendline function then connects the non n/a values and extends the connections of those points in a trendline.
//
// There is an option to draw the lines from the wicks or from the 'real bodies' of the candles.
// The trendlines can either extend infinitely or only run for an adjustable amount of bars.
//
// There's an option to display trendline breaks
// And the option to display trendlines in color or monochrome
//
保護スクリプト
このスクリプトのソースコードは非公開で投稿されています。 ただし、制限なく自由に使用できます – 詳細はこちらでご確認ください。
免責事項
この情報および投稿は、TradingViewが提供または推奨する金融、投資、トレード、その他のアドバイスや推奨を意図するものではなく、それらを構成するものでもありません。詳細は利用規約をご覧ください。
免責事項
この情報および投稿は、TradingViewが提供または推奨する金融、投資、トレード、その他のアドバイスや推奨を意図するものではなく、それらを構成するものでもありません。詳細は利用規約をご覧ください。