INVITE-ONLY SCRIPT
更新済 OHO ATM Machine
Studies Used:
We have used different type of candle stick patterns, open, close, high, low, Moving Averages, volumes and Average True Ranges in creation of this indicator.
Usage:
It can be used for scalping and intra-day trading. It works best on Nifty 5 Minutes , 15 Minutes, 1 Hour, Daily, Weekly and Monthly Time Frames.
It provides easy to visualize multiple information:
1) It gives the correct Entry on Time. Yellow ATM Area, Means No Trade.
2) Fake Signals are shown when There is Sell Signal and Below is ATM Area.
3) Fake Signals are shown when There is Buy Signal and Above is ATM Area.
4) It gives proper Target at the time of Entry.
5) Stop Loss is Hit when The Candle Closes below ATM Area in Buying and vice versa.
6) No Trade is Recommended, when ATM Area is Yellow.
How to read OHO ATM Machine Indicator?
Buy - When ATM Area is Turned Green in Color First Time after Last Red.
Sell - When ATM Area is Turned Red in Color First Time after Last Green.
Stop Loss - When The Candle Closes below ATM Area in Buy Trade and When The Candle Closes above ATM Area in Sell Trade.
Target - Thin Green Line for Buy Trade and Thin Red for Sell Trade.
Trailing SL - We can Trail the Trade, till the Stop Loss is HIT.
Recommendations:
This can be used for Nifty, Bank Nifty, Stocks, Commodities, Bitcoin, Currency and any other tradable instrument.
What time frame should I use?
5 Minutes and 15 Minutes are best time-frames for Intra-day Trades.
15 Minutes and Hourly are best time-frames for Swing Trades.
Hourly and Daily are best time-frames for Short Term Trades.
But you can check different time-frames in Strategy Testing section or as per your requirements.
Disclaimer:
Past performance is not the guarantee of future performance.
For any type of queries kindly send us personal message.
リリースノート
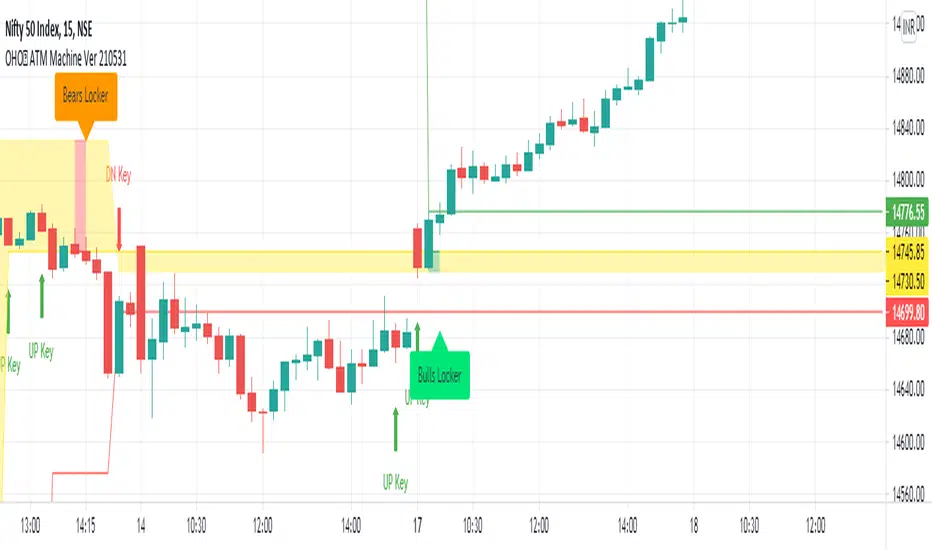
1.) Easy to Find Buy Entry when there is Bulls Locker.2.) Easy to Find Sell Entry when there is Bears Locker.
3.) Trailing Profit/Stop Loss Line will guide you to maximize the profits and minimize the losses.
4.) Dn Key Means Downside Entry for Risky Players along with given targets.
5.) Up Key Means Upside Entry for Risky Players along with given targets.
6.) Expected Range will give you clear information about the trading range.
7.) Expected Big Moves means trend is expected to be continued.
招待専用スクリプト
このスクリプトは作者が承認したユーザーのみアクセス可能です。使用するにはアクセス申請をして許可を得る必要があります。通常は支払い後に承認されます。詳細は下記の作者の指示に従うか、AIATMMACHINEに直接お問い合わせください。
TradingViewは、作者を完全に信頼し、スクリプトの動作を理解していない限り、有料スクリプトの購入・使用を推奨しません。コミュニティスクリプトには無料のオープンソースの代替が多数あります。
作者の指示
You Can send personal message to get the access. This is not available in public for Free.
免責事項
この情報および投稿は、TradingViewが提供または推奨する金融、投資、トレード、その他のアドバイスや推奨を意図するものではなく、それらを構成するものでもありません。詳細は利用規約をご覧ください。