PROTECTED SOURCE SCRIPT
更新済 Support and Resistance Lines [Swastik]
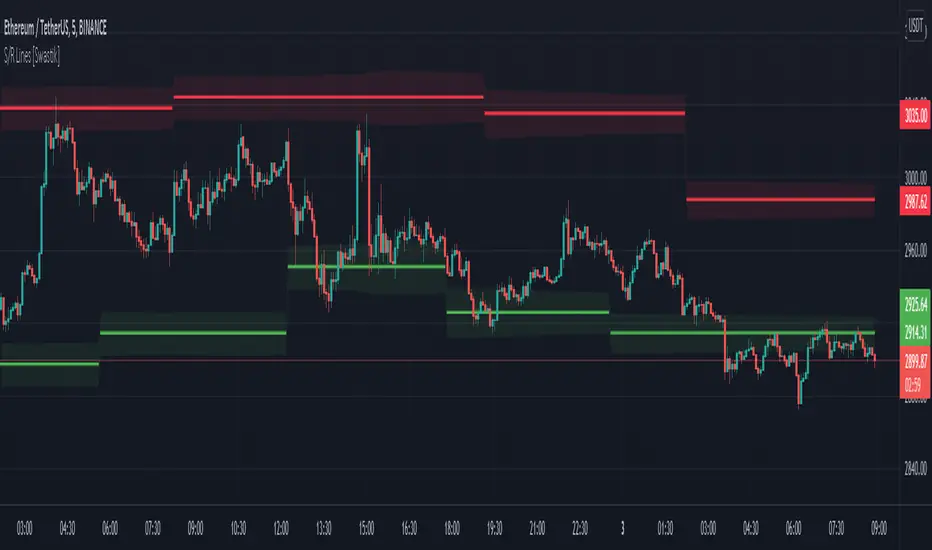
This indicator plots support and resistance lines automatically on the basis of the pivots created by the swings in the market.
You can increase the swing sensitivity if you want it to detect only larger swings.
There is a range drawn around the support and resistance lines based on the volatility of the market.
This works on every timeframe and the lines are drawn on the basis of swings in that timeframe.
This does not repaints and you can use it freely.
リリースノート
Added the alert conditions for crossing of the Support and Resistance Lines保護スクリプト
このスクリプトのソースコードは非公開で投稿されています。 ただし、制限なく自由に使用できます – 詳細はこちらでご確認ください。
免責事項
この情報および投稿は、TradingViewが提供または推奨する金融、投資、トレード、その他のアドバイスや推奨を意図するものではなく、それらを構成するものでもありません。詳細は利用規約をご覧ください。
保護スクリプト
このスクリプトのソースコードは非公開で投稿されています。 ただし、制限なく自由に使用できます – 詳細はこちらでご確認ください。
免責事項
この情報および投稿は、TradingViewが提供または推奨する金融、投資、トレード、その他のアドバイスや推奨を意図するものではなく、それらを構成するものでもありません。詳細は利用規約をご覧ください。