INVITE-ONLY SCRIPT
E³ Up-Down Volume % (NASDAQ)
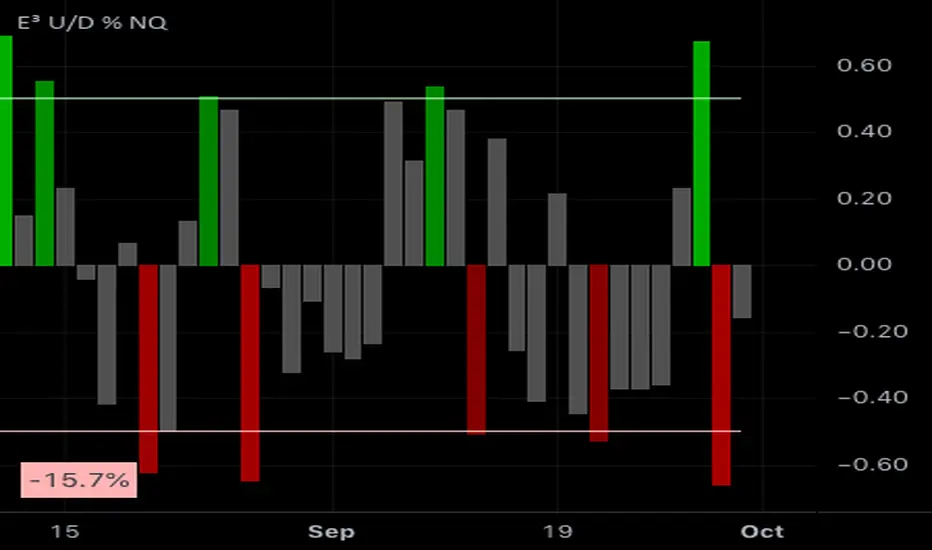
This lower indicator will show what % a day's total market volume on the NASDAQ COMPOSITE is bullish or bearish. It shows a history of every day's reading on a lower indicator pane.
Strong readings correspond to strong days and the differential in volume can often be ascertained from the market open and in the first 5-30 minutes of the market, to give you a sense of how the market might play out that day.
It is especially good at predicting STRONGEST days as well as DOJI days (indecision days).
EXAMPLES:
TECHNICALLY:
90% bullish = 95% of the volume on the day is UP (very rare, ie: once every 2+ years)
80% bullish = 90% of the volume is UP (rare, ie: once or twice a year)
50% bullish = 75% of volume is UP (significant when it occurs, but not uncommon)
0-1% bullish = 50% of volume is up
-50% bearish = 75% of the volume is DOWN
-80% bearish = 90% of the volume is DOWN
-90% bearish = 95% of the volume is DOWN
OPTIMUM SETTINGS = Threshold Percent to 45-55%
This means that roughly 3/4 of the volume transpiring(ed) on the day is either UP or DOWN and will color the histogram if levels are that strong (either bullish or bearish)
Strong readings correspond to strong days and the differential in volume can often be ascertained from the market open and in the first 5-30 minutes of the market, to give you a sense of how the market might play out that day.
It is especially good at predicting STRONGEST days as well as DOJI days (indecision days).
EXAMPLES:
- A +1% reading would mean that there is 1% more up volume on the day than down volume, meaning it's nearly a DOJI day or indecisive day where up down volume is basically 50/50 and the day is not particularly bullish (or bearish). Same goes for a very low bearish reading such as -1%.
- an 80% BULLISH reading would mean that the day's volume differential is hugely favoring the bullside (buying demand). These days are so strong in sentiment that they usually end up being STRONG BULLISH CONTINUATION candles with little to no topside wick by the end of the day.
- Conversely an 80% bearish candle would mean an intensely strong sell-side volume day.
TECHNICALLY:
90% bullish = 95% of the volume on the day is UP (very rare, ie: once every 2+ years)
80% bullish = 90% of the volume is UP (rare, ie: once or twice a year)
50% bullish = 75% of volume is UP (significant when it occurs, but not uncommon)
0-1% bullish = 50% of volume is up
-50% bearish = 75% of the volume is DOWN
-80% bearish = 90% of the volume is DOWN
-90% bearish = 95% of the volume is DOWN
OPTIMUM SETTINGS = Threshold Percent to 45-55%
This means that roughly 3/4 of the volume transpiring(ed) on the day is either UP or DOWN and will color the histogram if levels are that strong (either bullish or bearish)
招待専用スクリプト
このスクリプトは作者が承認したユーザーのみアクセス可能です。使用するにはアクセス申請をして許可を得る必要があります。通常は支払い後に承認されます。詳細は下記の作者の指示に従うか、evanevansmusicに直接お問い合わせください。
TradingViewは、作者を完全に信頼し、スクリプトの動作を理解していない限り、有料スクリプトの購入・使用を推奨しません。コミュニティスクリプトには無料のオープンソースの代替が多数あります。
作者の指示
HOW TO PUT ON YOUR CHARTS:
Find out how to get this indicator for your charts here:
https://www.e3tradinggroup.com
+517% in 1 year! 🏆 30+ yrs Experience🥇Top Verified Trader on Profit.ly/evanevans ⚡Day Trader, Swing Trader, Mentor
免責事項
この情報および投稿は、TradingViewが提供または推奨する金融、投資、トレード、その他のアドバイスや推奨を意図するものではなく、それらを構成するものでもありません。詳細は利用規約をご覧ください。