PROTECTED SOURCE SCRIPT
Normalized Candle Spread with MA
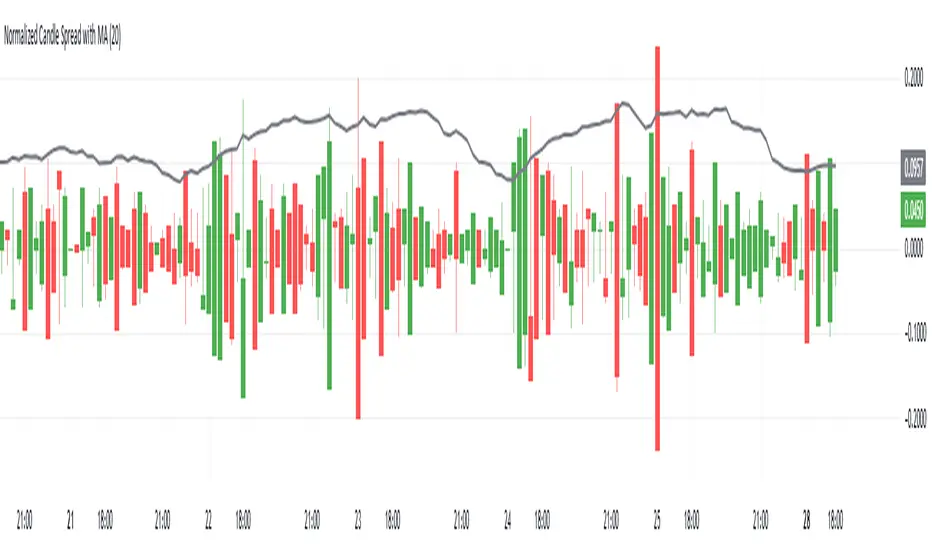
This Pine Script indicator, "Normalized Candle Spread with MA," visualizes candle price action by normalizing the candle bodies and wicks around a baseline (zero level). The normalization centers each candle’s high, low, open, and close prices relative to its own spread (high minus low), so all candles are plotted on the same horizontal line for easy comparison of their shapes and relative sizes.
Key features:
Normalization: Adjusts candle components (open, close, high, low) so they are centered around zero, allowing the comparison of candle shapes regardless of their absolute price levels.
Candle colors: Green for bullish candles (close ≥ open) and red for bearish candles (close < open).
Spread Moving Average: Plots a simple moving average (SMA) of the candle spreads over a user-defined period for visual reference of average volatility.
This indicator helps traders visually assess candle volatility and structure normalized over time, rather than focusing on price levels.
保護スクリプト
このスクリプトのソースコードは非公開で投稿されています。 しかし、無料かつ制限なしでご利用いただけます ― 詳細についてはこちらをご覧ください。
免責事項
これらの情報および投稿は、TradingViewが提供または保証する金融、投資、取引、またはその他の種類のアドバイスや推奨を意図したものではなく、またそのようなものでもありません。詳しくは利用規約をご覧ください。
保護スクリプト
このスクリプトのソースコードは非公開で投稿されています。 しかし、無料かつ制限なしでご利用いただけます ― 詳細についてはこちらをご覧ください。
免責事項
これらの情報および投稿は、TradingViewが提供または保証する金融、投資、取引、またはその他の種類のアドバイスや推奨を意図したものではなく、またそのようなものでもありません。詳しくは利用規約をご覧ください。