INVITE-ONLY SCRIPT
更新済 WhaleCrew Overlay
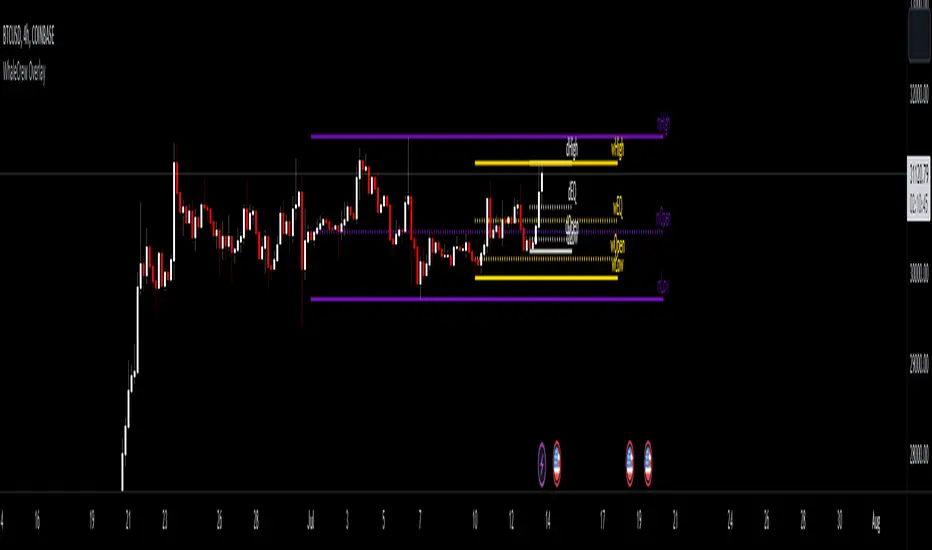
This overlay is all about looking for confluence, and this is achieved by combining the power of Support/Resistance trading and Moving Averages.
Features
Support and Resistance
This involves Daily Levels (High, Low, Open, and Range Center), Weekly Levels (Open, High and Low), as well as the Monthly/Quarterly/Yearly Open.
Automatically having these support/resistance levels on your chart no matter what timeframe you're on is a big advantage, they can be used as confluence levels for potential trades.
Trend Visualization
Our trend component visualizes the current trend using two moving averages. There are multiple inbuilt modes that should be picked based on your trading style.
Use this indicator as confluence and don't rely solely on it.
Fib Ribbons
Our Fib Ribbons are a bundle of multiple EMAs with custom timeframe built-in. Unlike EMA Ribbons our EMA lengths are only based on Fibonacci Numbers.
The numbers of EMAs is four by default (fastest: 8, slowest: 34), but EMA 5 & 55 can be manually enabled.
The ribbons will act as support in an uptrend and as resistance in a downtrend. A ribbon cross often indicates a potential trend change.
Moving Average System
Build a system around 2 custom moving averages for more confluence (supports custom timeframes and many moving average types).
The moving averages can be used for generating signals whenever they cross, or as possible support/resistance.
Intraday Tools
We also support intraday tools like VWAP (Volume-Weighted-Average Price) and TWAP (Time-Weighted-Average-Price).
They differ from normal moving averages by taking volume/time into account and will act as potential support/resistance (commonly used by big market participants).
Usage
You should look for price levels where moving averages and support/resistance are lined up for confluence.
Closely monitor price action near important price levels for potential trade setups:
Access to this indicator can be obtained through our website.
Features
- Support and Resistance
- Trend Visualization
- Fib Ribbons
- Moving Average System
- Intraday Tools
Support and Resistance
This involves Daily Levels (High, Low, Open, and Range Center), Weekly Levels (Open, High and Low), as well as the Monthly/Quarterly/Yearly Open.
Automatically having these support/resistance levels on your chart no matter what timeframe you're on is a big advantage, they can be used as confluence levels for potential trades.
Trend Visualization
Our trend component visualizes the current trend using two moving averages. There are multiple inbuilt modes that should be picked based on your trading style.
Use this indicator as confluence and don't rely solely on it.
Fib Ribbons
Our Fib Ribbons are a bundle of multiple EMAs with custom timeframe built-in. Unlike EMA Ribbons our EMA lengths are only based on Fibonacci Numbers.
The numbers of EMAs is four by default (fastest: 8, slowest: 34), but EMA 5 & 55 can be manually enabled.
The ribbons will act as support in an uptrend and as resistance in a downtrend. A ribbon cross often indicates a potential trend change.
Moving Average System
Build a system around 2 custom moving averages for more confluence (supports custom timeframes and many moving average types).
The moving averages can be used for generating signals whenever they cross, or as possible support/resistance.
Intraday Tools
We also support intraday tools like VWAP (Volume-Weighted-Average Price) and TWAP (Time-Weighted-Average-Price).
They differ from normal moving averages by taking volume/time into account and will act as potential support/resistance (commonly used by big market participants).
Usage
You should look for price levels where moving averages and support/resistance are lined up for confluence.
Closely monitor price action near important price levels for potential trade setups:
- Consolidation right below resistance is considered bullish
- Consolidation right at support might be considered bearish
- Watch out for rejections and retests (also counts for moving averages)
Access to this indicator can be obtained through our website.
リリースノート
Restructured inputsリリースノート
Removed "Trend" sectionリリースノート
Adjusted default settingsリリースノート
Recoded SR Section-fixed dynamic SR levels (daily high/low and range center)
-removed weekly high/low
-adjusted default colors of daily/quarterly/yearly open
リリースノート
Removed Symbolsリリースノート
Release of Recode (v1.0.0)招待専用スクリプト
このスクリプトは作者が承認したユーザーのみアクセス可能です。使用するにはアクセス申請をして許可を得る必要があります。通常は支払い後に承認されます。詳細は下記の作者の指示に従うか、WhaleCrewに直接お問い合わせください。
TradingViewは、作者を完全に信頼し、スクリプトの動作を理解していない限り、有料スクリプトの購入・使用を推奨しません。コミュニティスクリプトには無料のオープンソースの代替が多数あります。
作者の指示
Access to this indicator can be obtained through our website.
免責事項
この情報および投稿は、TradingViewが提供または推奨する金融、投資、トレード、その他のアドバイスや推奨を意図するものではなく、それらを構成するものでもありません。詳細は利用規約をご覧ください。
招待専用スクリプト
このスクリプトは作者が承認したユーザーのみアクセス可能です。使用するにはアクセス申請をして許可を得る必要があります。通常は支払い後に承認されます。詳細は下記の作者の指示に従うか、WhaleCrewに直接お問い合わせください。
TradingViewは、作者を完全に信頼し、スクリプトの動作を理解していない限り、有料スクリプトの購入・使用を推奨しません。コミュニティスクリプトには無料のオープンソースの代替が多数あります。
作者の指示
Access to this indicator can be obtained through our website.
免責事項
この情報および投稿は、TradingViewが提供または推奨する金融、投資、トレード、その他のアドバイスや推奨を意図するものではなく、それらを構成するものでもありません。詳細は利用規約をご覧ください。