PROTECTED SOURCE SCRIPT
Blended Net Liquidity Correlation
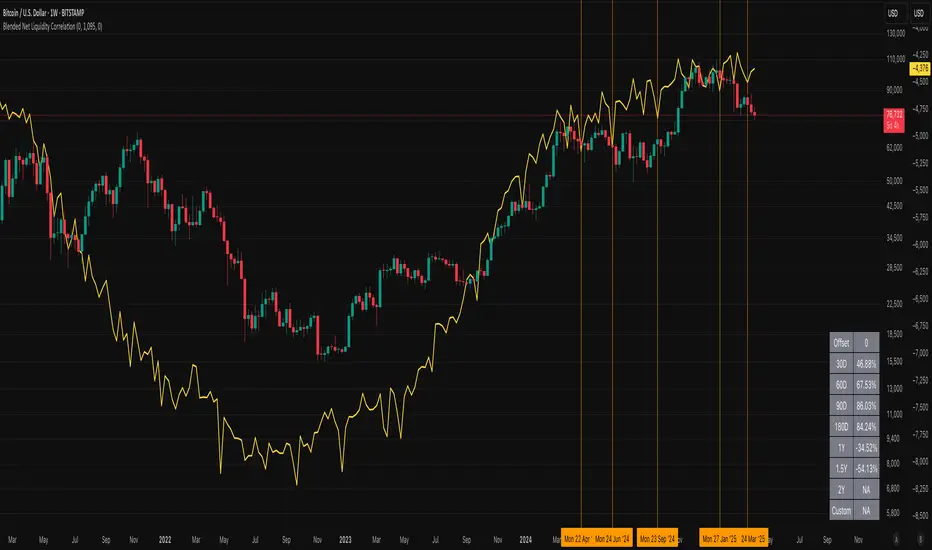
This indicator visualizes a customizable net liquidity metric based on key U.S. Federal Reserve and Treasury data from FRED. It allows users to blend two liquidity models:
• With WALCL: Incorporates the Fed’s total balance sheet (WALCL) — ideal for capturing long-term structural liquidity from QE/QT.
• Without WALCL: Excludes the balance sheet and focuses on short-term operational flows like RRP, TGA, BTFP, and commercial lending.
Use the “Weight on WALCL” slider to find your optimal blend. A setting of 1.0 uses only WALCL, 0.0 uses only short-term flows, and any value in between gives a mix.
The indicator also calculates the correlation between net liquidity and price over various timeframes:
• 30D, 60D, 90D, 180D
• 1Y, 1.5Y, 2Y
• A custom length (default 3 years)
保護スクリプト
このスクリプトのソースコードは非公開で投稿されています。 ただし、制限なく自由に使用できます – 詳細はこちらでご確認ください。
免責事項
この情報および投稿は、TradingViewが提供または推奨する金融、投資、トレード、その他のアドバイスや推奨を意図するものではなく、それらを構成するものでもありません。詳細は利用規約をご覧ください。
保護スクリプト
このスクリプトのソースコードは非公開で投稿されています。 ただし、制限なく自由に使用できます – 詳細はこちらでご確認ください。
免責事項
この情報および投稿は、TradingViewが提供または推奨する金融、投資、トレード、その他のアドバイスや推奨を意図するものではなく、それらを構成するものでもありません。詳細は利用規約をご覧ください。