PROTECTED SOURCE SCRIPT
更新済 Max Stop Loss - Risk Management Visualizer

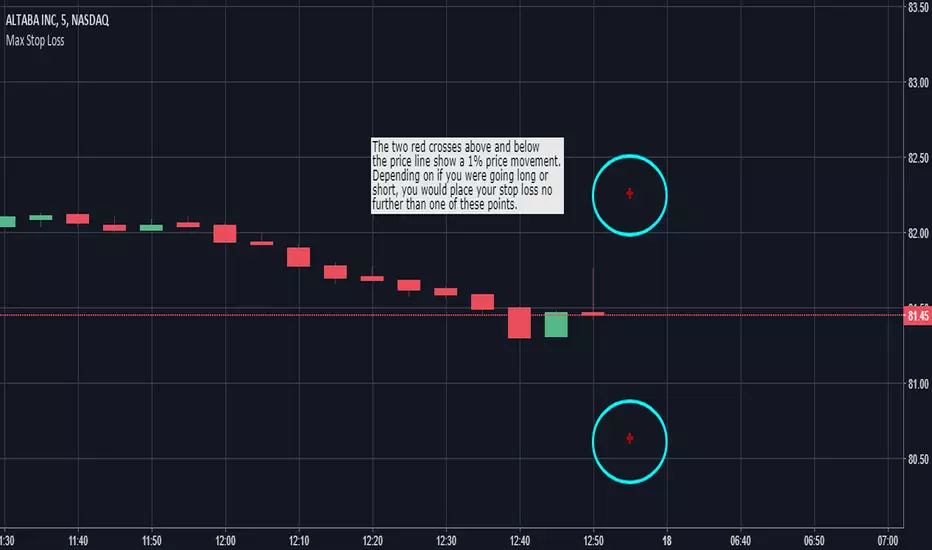
This indicator helps traders implement proper risk management in their trading. For example, let's say that you were trading a $1,000 account and didn't want to risk more than 1% of your account on any one trade. If you were placing $100 positions, you wouldn't want the price to move more than 10% against you (10% of $100 is $10, which is 1% of $1,000). So, assuming you were trading without any leverage, you would put "1000" into the "Max Stop Loss %" field in the format box and the indicator would display red crosses 10% above and below the current price of the market you are looking at. If you were going to take that same trade with 10x leverage, you would want to enter "100" into the indicator's format box and the red crosses would then plot themselves 1% above and below the current price.
"Max Stop Loss - Risk Management Visualizer" is able to show all the way down to a 0.01% price variation with no upper limit.
"Max Stop Loss - Risk Management Visualizer" is able to show all the way down to a 0.01% price variation with no upper limit.
リリースノート
************ UPDATE ************I have added additional fields in the Format box. You can now enter your total funds, how large your lot size will be, your maximum acceptable loss, as well as if you're using any leverage. The indicator will then do the math to calculate everything out for you.
Note, the Max Loss % is based on your TOTAL ACCOUNT. So, if you had a $1,000 account and set the indicator to 1%, "Max Stop Loss - Risk Management Visualizer" will display crosses that would put you at losing no more than $10/trade, regardless of your Lot Size and Leverage. How far the price could move before hitting that 1% will be affected by your Lot Size and Leverage, though.
So, let's assume that you're using the $1,000 account size with a 1% risk parameters. If you are buying a $100 lot with no leverage, the price would have to go against you by 10% in order for you to lose 1% of your account ($10). If you were trading with 10x leverage, though, the price would only have to go against you by 1%. That's why those parameters are now included in the indicator's Format box.
リリースノート
*Updated again to get the example chart to display correctly*保護スクリプト
このスクリプトのソースコードは非公開で投稿されています。 ただし、制限なく自由に使用できます – 詳細はこちらでご確認ください。
免責事項
この情報および投稿は、TradingViewが提供または推奨する金融、投資、トレード、その他のアドバイスや推奨を意図するものではなく、それらを構成するものでもありません。詳細は利用規約をご覧ください。
保護スクリプト
このスクリプトのソースコードは非公開で投稿されています。 ただし、制限なく自由に使用できます – 詳細はこちらでご確認ください。
免責事項
この情報および投稿は、TradingViewが提供または推奨する金融、投資、トレード、その他のアドバイスや推奨を意図するものではなく、それらを構成するものでもありません。詳細は利用規約をご覧ください。