PROTECTED SOURCE SCRIPT
Bollinger Bands %b Trend | Dextra
Overview
The Bollinger Bands %b Trend | Dextra is a custom technical indicator designed to enhance trend identification using the Bollinger Bands %b concept. This indicator calculates the percentage position of the price relative to the Bollinger Bands and uses customizable thresholds to determine bullish or bearish trends. It integrates dynamic candle coloring and a clear visual representation to assist traders in making informed decisions.
Key Features
- Bollinger Bands %b Calculation: Measures the price's position between the upper and lower Bollinger Bands as a percentage, providing a normalized view of overbought or oversold conditions.
- Trend Detection: Identifies uptrends and downtrends based on user-defined thresholds, offering a straightforward trend-following approach.
- Dynamic Candle Coloring: Colors candles according to the detected trend (green for uptrend, magenta for downtrend, gray for neutral), enhancing visual trend analysis.
- Customizable Parameters: Allows adjustment of length, standard deviation multiplier, and trend thresholds to suit various market conditions and trading styles.
How It Works
1. Bollinger Bands Calculation:
- The indicator uses an Exponential Moving Average (EMA) as the basis, calculated with a user-defined `length` (default 34).
- Upper and lower bands are derived by adding and subtracting a multiple of the standard deviation (`mult`, default 2.0) from the EMA.
- The %b value is computed as `(src - lower) / (upper - lower)`, where `src` is the price source (default `close`).
2. Trend Identification:
- An uptrend is detected when %b exceeds the `upperthreshold` (default 0.75).
- A downtrend is detected when %b falls below the `lowerthreshold` (default 0.26).
- The trend state is maintained until a new threshold condition is met.
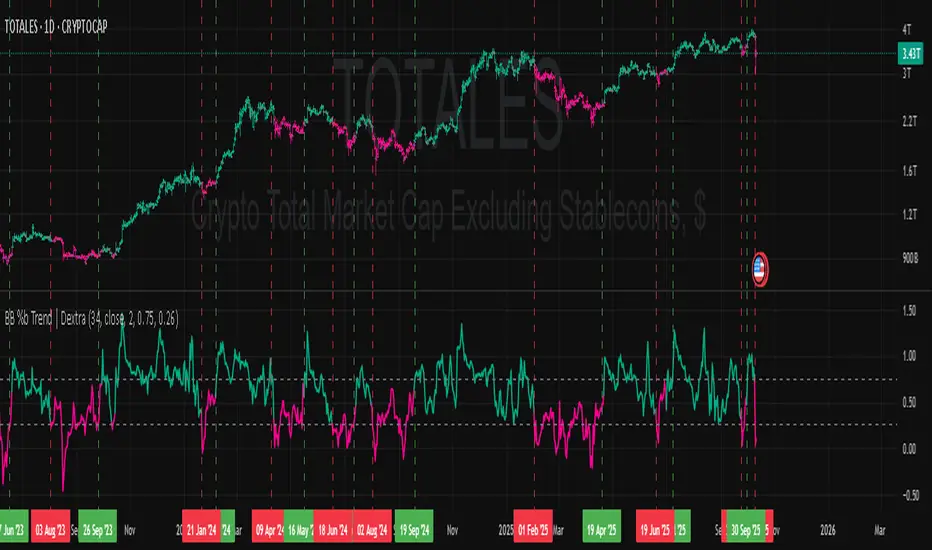
3. Visualization:
- The %b line is plotted with a color reflecting the trend (green for uptrend, magenta for downtrend, gray for neutral).
- Horizontal dashed lines mark the uptrend and downtrend thresholds for reference.
- Candles are colored to match the trend, providing an overlay visualization on the price chart.
Customization Options
- Length: Adjust the EMA and standard deviation period (default 34, min 1).
- Source: Select the price data source for calculations (default `close`).
- StdDev: Set the standard deviation multiplier for band width (default 2.0, range 0.001 to 50).
- Uptrend Threshold: Define the %b level for uptrend detection (default 0.75, step 0.01).
- Downtrend Threshold: Define the %b level for downtrend detection (default 0.26, step 0.01).
Ideal Use Cases
- Trend Following: Perfect for traders seeking to capitalize on sustained price movements with clear entry and exit signals.
- Volatility Analysis: Useful for identifying periods of high or low volatility when combined with the %b positioning.
- Complementary Tool: Works well alongside momentum indicators (e.g., RSI) or volume-based tools to confirm trend strength.
#### Disclaimer
This indicator is provided for educational and informational purposes only. It is not intended to serve as financial advice or a guaranteed method for trading success. Trading involves significant risks, including the potential loss of capital. Users are solely responsible for their trading decisions and should conduct their own analysis and apply appropriate risk management strategies.
Notes
- Ensure your chart has sufficient historical data to reflect accurate Bollinger Bands calculations.
- Test the indicator on a demo account before using it in live trading to validate its performance with your preferred assets and timeframes.
This indicator is a versatile addition to any trader's toolkit, offering a blend of trend detection and visual clarity tailored to modern trading needs.
The Bollinger Bands %b Trend | Dextra is a custom technical indicator designed to enhance trend identification using the Bollinger Bands %b concept. This indicator calculates the percentage position of the price relative to the Bollinger Bands and uses customizable thresholds to determine bullish or bearish trends. It integrates dynamic candle coloring and a clear visual representation to assist traders in making informed decisions.
Key Features
- Bollinger Bands %b Calculation: Measures the price's position between the upper and lower Bollinger Bands as a percentage, providing a normalized view of overbought or oversold conditions.
- Trend Detection: Identifies uptrends and downtrends based on user-defined thresholds, offering a straightforward trend-following approach.
- Dynamic Candle Coloring: Colors candles according to the detected trend (green for uptrend, magenta for downtrend, gray for neutral), enhancing visual trend analysis.
- Customizable Parameters: Allows adjustment of length, standard deviation multiplier, and trend thresholds to suit various market conditions and trading styles.
How It Works
1. Bollinger Bands Calculation:
- The indicator uses an Exponential Moving Average (EMA) as the basis, calculated with a user-defined `length` (default 34).
- Upper and lower bands are derived by adding and subtracting a multiple of the standard deviation (`mult`, default 2.0) from the EMA.
- The %b value is computed as `(src - lower) / (upper - lower)`, where `src` is the price source (default `close`).
2. Trend Identification:
- An uptrend is detected when %b exceeds the `upperthreshold` (default 0.75).
- A downtrend is detected when %b falls below the `lowerthreshold` (default 0.26).
- The trend state is maintained until a new threshold condition is met.
3. Visualization:
- The %b line is plotted with a color reflecting the trend (green for uptrend, magenta for downtrend, gray for neutral).
- Horizontal dashed lines mark the uptrend and downtrend thresholds for reference.
- Candles are colored to match the trend, providing an overlay visualization on the price chart.
Customization Options
- Length: Adjust the EMA and standard deviation period (default 34, min 1).
- Source: Select the price data source for calculations (default `close`).
- StdDev: Set the standard deviation multiplier for band width (default 2.0, range 0.001 to 50).
- Uptrend Threshold: Define the %b level for uptrend detection (default 0.75, step 0.01).
- Downtrend Threshold: Define the %b level for downtrend detection (default 0.26, step 0.01).
Ideal Use Cases
- Trend Following: Perfect for traders seeking to capitalize on sustained price movements with clear entry and exit signals.
- Volatility Analysis: Useful for identifying periods of high or low volatility when combined with the %b positioning.
- Complementary Tool: Works well alongside momentum indicators (e.g., RSI) or volume-based tools to confirm trend strength.
#### Disclaimer
This indicator is provided for educational and informational purposes only. It is not intended to serve as financial advice or a guaranteed method for trading success. Trading involves significant risks, including the potential loss of capital. Users are solely responsible for their trading decisions and should conduct their own analysis and apply appropriate risk management strategies.
Notes
- Ensure your chart has sufficient historical data to reflect accurate Bollinger Bands calculations.
- Test the indicator on a demo account before using it in live trading to validate its performance with your preferred assets and timeframes.
This indicator is a versatile addition to any trader's toolkit, offering a blend of trend detection and visual clarity tailored to modern trading needs.
保護スクリプト
このスクリプトのソースコードは非公開で投稿されています。 しかし、無料かつ制限なしでご利用いただけます ― 詳細についてはこちらをご覧ください。
免責事項
これらの情報および投稿は、TradingViewが提供または保証する金融、投資、取引、またはその他の種類のアドバイスや推奨を意図したものではなく、またそのようなものでもありません。詳しくは利用規約をご覧ください。
免責事項
これらの情報および投稿は、TradingViewが提供または保証する金融、投資、取引、またはその他の種類のアドバイスや推奨を意図したものではなく、またそのようなものでもありません。詳しくは利用規約をご覧ください。