PROTECTED SOURCE SCRIPT
First X Hours – Daily & Weekly (Auto-DST, Midlines & Labels)
Description
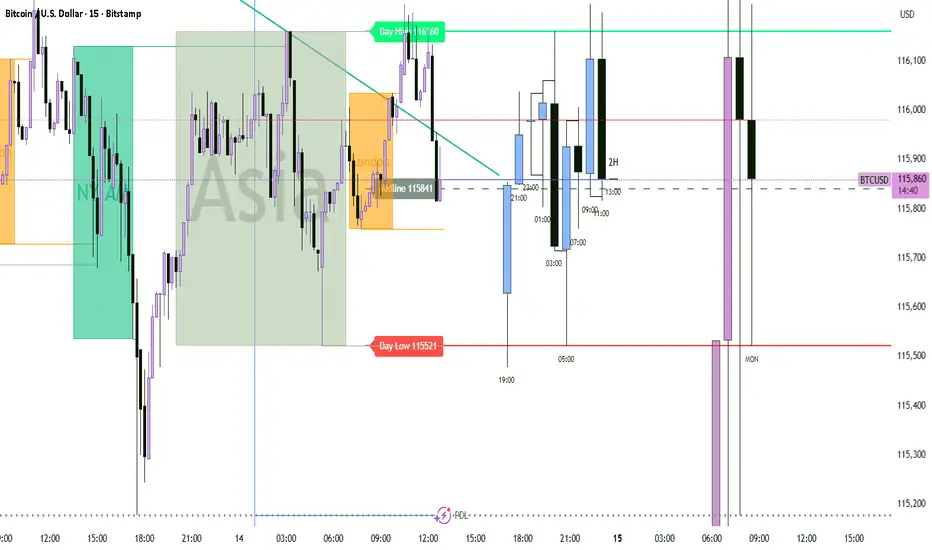
This indicator automatically plots the High, Low, and optional Midline of the first X trading hours for both the Daily and Weekly sessions. It is designed for traders who want to quickly identify early-session ranges and key levels that often act as intraday or intraweek support/resistance zones.
✅ Features:
Works for both Daily and Weekly sessions (enable/disable individually).
Fully configurable: choose how many hours to include (e.g., 8 hours).
Adjustable start time (hour) and automatic DST handling using named timezones (e.g., Europe/London, New York, Sydney).
Customizable line colours, thickness, and styles.
Optional midline (average of high & low) for range balance levels.
Optional labels with price tags for clear visibility.
Lines can be extended to the right for forward-projection.
🔎 Use cases:
Identify early-session ranges that may define the trading day or week.
Track breakouts above/below first-X-hours ranges.
Highlight key liquidity levels where price often reacts.
Combine with your strategy for confirmation of reversals or continuations.
⚠️ Note:
Indicator does not provide trading signals.
Best used on intraday timeframes (e.g., 5m–1h) for daily ranges, and H1–H4 for weekly ranges.
保護スクリプト
このスクリプトのソースコードは非公開で投稿されています。 しかし、無料かつ制限なしでご利用いただけます ― 詳細についてはこちらをご覧ください。
免責事項
これらの情報および投稿は、TradingViewが提供または保証する金融、投資、取引、またはその他の種類のアドバイスや推奨を意図したものではなく、またそのようなものでもありません。詳しくは利用規約をご覧ください。
免責事項
これらの情報および投稿は、TradingViewが提供または保証する金融、投資、取引、またはその他の種類のアドバイスや推奨を意図したものではなく、またそのようなものでもありません。詳しくは利用規約をご覧ください。