PROTECTED SOURCE SCRIPT
BB+RSI by RA
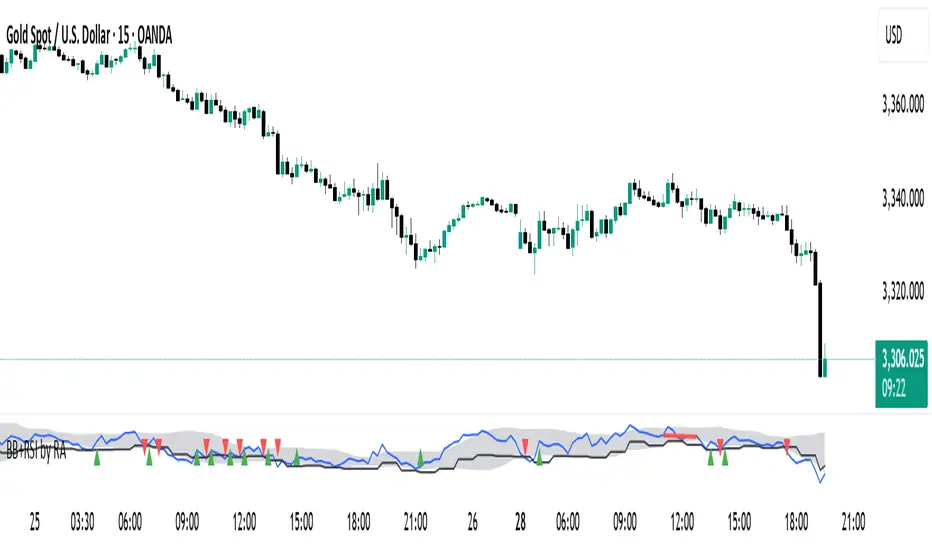
This indicator gives buy/sell signal based on BB & RSI. In this indicator BB is placed on RSI and works better with std. dev. 1.5.
BUY signal when chart RSI is above HTF RSI and BB basis (with option to change BB upper and BB lower).
SELL signal when chart RSI is below HTF RSI and BB basis.
HTF calculation is 1. for 1M = 15 M. 2. for 3M/5M/15M/30M =1H. 3. for 1H/2H/4H = 1D.
This Indicator shows bullish and bearish divergences also.
保護スクリプト
このスクリプトのソースコードは非公開で投稿されています。 しかし、無料かつ制限なしでご利用いただけます ― 詳細についてはこちらをご覧ください。
免責事項
これらの情報および投稿は、TradingViewが提供または保証する金融、投資、取引、またはその他の種類のアドバイスや推奨を意図したものではなく、またそのようなものでもありません。詳しくは利用規約をご覧ください。
保護スクリプト
このスクリプトのソースコードは非公開で投稿されています。 しかし、無料かつ制限なしでご利用いただけます ― 詳細についてはこちらをご覧ください。
免責事項
これらの情報および投稿は、TradingViewが提供または保証する金融、投資、取引、またはその他の種類のアドバイスや推奨を意図したものではなく、またそのようなものでもありません。詳しくは利用規約をご覧ください。