INVITE-ONLY SCRIPT
更新済 RSI Performance - TradingED
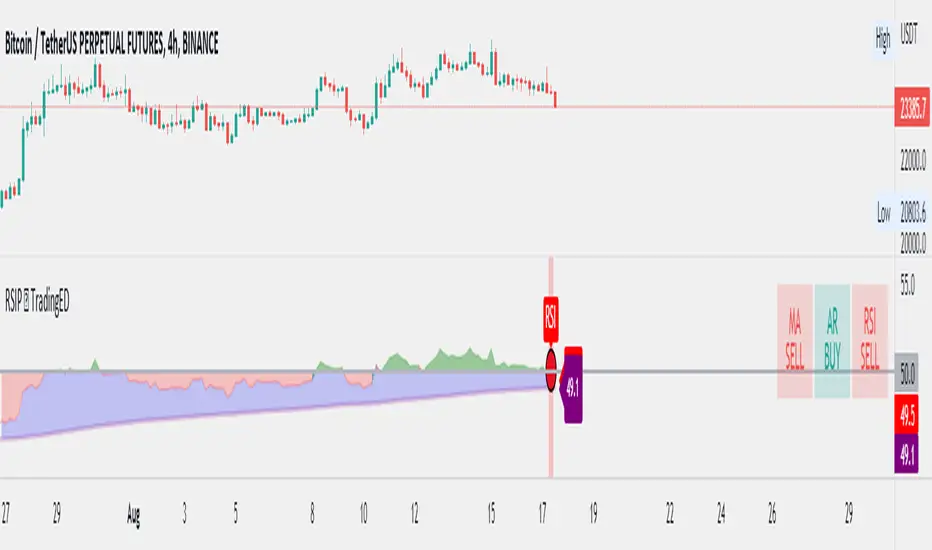
This case study is based on a previous RSI study, but with three different counts to compare different trends. The use of this indicator is restricted to private use, and it can be used only by invitation. Different functionalities have been added to the original code, such as alerts and signals that seek to make trading much easier to interpret by any type of trading operator of any experience level, from beginner to intermediate and advanced .
Key components of the original indicator:
● The Relative Strength Index ( RSI ) is a popular momentum oscillator developed in 1978.
● The RSI provides technical traders signals about bullish and bearish price momentum, and it is often plotted beneath the graph of an asset's price.
● An asset is usually considered overbought when the RSI is above 70% and oversold when it is below 30%.
It is a momentum indicator used in technical analysis that measures the magnitude of recent price changes to assess overbought or oversold conditions in the price of an asset. The RSI is displayed as an oscillator (a line chart moving between two extremes) and can read from 0 to 100. Overbought does not necessarily mean that the price will reverse lower, just as oversold does not mean that the price will reverse higher. Rather, the overbought and oversold conditions simply alert traders that the RSI is near the extremes of its recent readings.
Main functions of this modified indicator:
1) The SOURCE for the counts can be determined by the trader (close, open, etc).
2) You can select the type of MOVING AVERAGE, among many available options ( SMA , EMA , DEMA , HMA , etc.)
3) The MEASURE can be based on a CANDLES count if you are trading OHLC Charts from 1D onwards, or if your trading is intraday, you can also select counts by MINUTES, HOURS or DAYS, depending on your trading style.
4) LENGTH, by default it will be loaded as in the STRATEGY, but considering the previous point, you can modify it according to your convenience.
5) You have the option to hide or show a LABEL at the top of the chart, with respect to the signals: BULLISH green, BEARISH red.
Main performance functions of this modified indicator:
I) In the case of the PERFORMANCE that appears at the right of the chart, you have the option to adjust the WIDTH of each box.
II) The TEXT of the PERFORMANCE is not modifiable, but you can customize the default color. *
III) The BACKGROUND of the PERFORMANCE, you can customize the default color. *
IV) You have the option to hide or show a PERFORMANCE that appears at the right of the chart.
Main functions to customize the style of this indicator:
a) You can select the color for the ADJUSTED LEVEL and for the MOVING AVERAGE, with the colors that best suit you.
b) The CROSSOVER/CROSSUNDER signal between the MOVING AVERAGE and the ADJUSTED LEVEL can also be customized. *
c) For any type of SIGNAL, it is painted as a VERTICAL LINE in the graph, you can change the color that comes by default. *
d) In the case of the LABEL that appear at the top, the text is not modifiable, but you can customize both the type of label and change the default color. *
e) You can select the color for OVERVALUED and for UNDERVALUED levels, with the colors that best suit you.
f) You can select the colors for the BACKGROUND of the indicator according to the trend, whether it is BEARISH or BULLISH, with the colors that best suit you. *
* By default, they are marked as red for downtrends and green for uptrends.
リリースノート
Emoticons aded!リリースノート
MA added.リリースノート
New Features!リリースノート
New Versionリリースノート
New Performanceリリースノート
New color configリリースノート
New simplified color settings.リリースノート
Bug Fixed!リリースノート
New MA background & colors! 招待専用スクリプト
このスクリプトは作者が承認したユーザーのみアクセス可能です。使用するにはアクセス申請をして許可を得る必要があります。通常は支払い後に承認されます。詳細は下記の作者の指示に従うか、Trading_EDに直接お問い合わせください。
TradingViewは、作者を完全に信頼し、スクリプトの動作を理解していない限り、有料スクリプトの購入・使用を推奨しません。コミュニティスクリプトには無料のオープンソースの代替が多数あります。
作者の指示
Get access:
https://trading-ed.com/product/rsi-performance/
We are a community of Traders interested in applying adequate Risk Management for Financial Markets.
免責事項
この情報および投稿は、TradingViewが提供または推奨する金融、投資、トレード、その他のアドバイスや推奨を意図するものではなく、それらを構成するものでもありません。詳細は利用規約をご覧ください。
招待専用スクリプト
このスクリプトは作者が承認したユーザーのみアクセス可能です。使用するにはアクセス申請をして許可を得る必要があります。通常は支払い後に承認されます。詳細は下記の作者の指示に従うか、Trading_EDに直接お問い合わせください。
TradingViewは、作者を完全に信頼し、スクリプトの動作を理解していない限り、有料スクリプトの購入・使用を推奨しません。コミュニティスクリプトには無料のオープンソースの代替が多数あります。
作者の指示
Get access:
https://trading-ed.com/product/rsi-performance/
We are a community of Traders interested in applying adequate Risk Management for Financial Markets.
免責事項
この情報および投稿は、TradingViewが提供または推奨する金融、投資、トレード、その他のアドバイスや推奨を意図するものではなく、それらを構成するものでもありません。詳細は利用規約をご覧ください。