INVITE-ONLY SCRIPT
更新済 Precision Swing Point (2-Stage) - SMT [Pogiest]
General
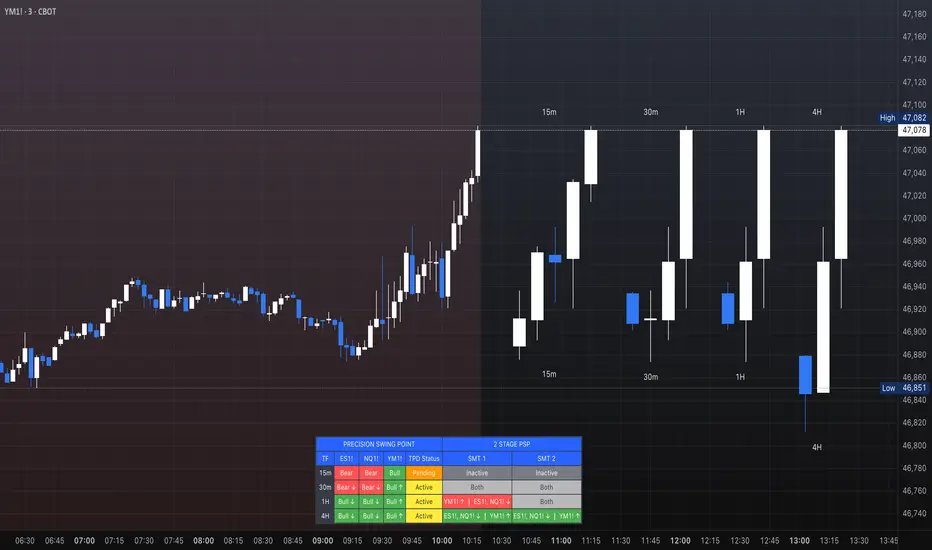
Precision Swing Point (PSP) is a concept derived from Quarterly Theory concepts originating from ICT methodologies. The concept typically uses a 3-candle swing formation in which candle 2 has a divergence in the closing price with one asset compared to the other two assets in a correlated asset triad (i.e. one closes bullish and other two closes bearish, vice-versa). A Terminus Price Divergence (TPD) is an additional divergence between candle 1’s closing price and candle 3’s opening price (i.e. one asset’s candle 3 opening price opens below candle 1 closing price while the other two assets’ candle 3 opening price opens above candle 1 closing price, vice-versa). The candle 3 divergence and candle 2 divergence put together is what defines a TPD. This indicator is designed to track TPDs in real time as they are forming. Additionally, the indicator tracks SMT (Smart Money Technique) divergences between Candle 1/Candle 2 highs/lows and Candle 2/Candle 3 high/lows.
Note: Credit of concepts/ideas goes to TraderDaye, JacobSpeculates, The Market Lens Team, and ICT.
In the image above, the higher timeframe candle overlay are displayed on the chart to be shown as an example with the indicator (table). Higher timeframe candles are not included as part of the indicator. This indicator is only comprised of the table shown.
How the Indicator Table Works
Timeframe Column:
1. Displays up to four different timeframes to monitor.
Asset Columns:
1. Cells display “Bull” or “Bear” showing the current state of each candle and updates in real-time tick by tick.
TPD Status Column (see defined divergences in General section above):
1. “Inactive” indicates no divergence in all assets (i.e. all three assets in a triad are all printing bullish or bearish candles)
2. “Pending” indicates a potential divergence in candle 2’s closing price (i.e. one asset’s current state in candle 2 is bearish while the others are bullish, vice versa). This updates in real-time tick by tick and continues to monitor each candle as they form for a candle 2 divergence.
3. “Active” indicates a confirmed TPD in which both a candle 2 divergence and candle 3 divergence (i.e. divergence between candle 3 opening price and candle 1 closing price) exists.
Note 1: If candle 2 has an asset in a correlated triad close as a doji candle (opening price and closing price are exactly the same) while the other two assets close bullish or bearish, the indicator will not deem candle 2 as a valid PSP candle. There has to be a divergence in the opening/closing price on at least two assets to be valid.
Note 2: Any historical TPDs will not be displayed in the table as this indicator only tracks TPDs in real time and continuously monitors for potential TPDs and confirmed TPDs.
Added Feature (2 Stage PSP)
SMT 1: Displays an SMT consecutive candle divergence between candle 1 and candle 2’s highs and lows. This is displayed once a TPD is in “Active” status while candle 3 is printing. Therefore, the label in the table cell displays past data (Candle 1 and Candle 2 high/low SMTs).
1. “Inactive” indicates there were no SMT divergences.
2. “Asset symbol names” are displayed with a corresponding up arrow or down arrow. Cell background color is red for SMT Divergence at the highs and green for SMT Divergence at the lows. For example, if there was a bearish SMT at the highs of candle 1/candle 2 and one asset made the higher high in candle 2, then that asset would have the up arrow indicating it swept candle 1’s high while the other assets have the down arrow as they did not sweep candle 1’s high. This works vice versa for bullish scenario.
3. “Both” indicates there are SMT divergences at both the highs and lows of candle 1 and candle 2.
SMT 2: Displays an SMT consecutive candle divergence between candle 2 and candle 3’s highs and lows. This is displayed while a TPD is in “Active” status and updates in real-time tick by tick during candle 3’s price action.
1. “Inactive” indicates there are no current SMT divergences.
2. “Asset symbol names” are displayed with a corresponding up arrow or down arrow. Cell background color is red for SMT Divergence at the highs and green for SMT Divergence at the lows. For example, if there was a bearish SMT at the highs of candle 2/candle 3 and one asset made the higher high in candle 3, then that asset would have the up arrow indicating it swept candle 2’s high while the other assets have the down arrow as they did not sweep candle 2’s high. If one of the assets that did not sweep candle 2’s high ends up sweeping the high, then that asset will dynamically move to the left of the cell next to the asset that swept candle 2’s high with an up arrow leaving only one asset with the down arrow. If the last asset ends up sweeping candle 2’s high, then the cell would change to “Inactive”. This works vice versa for bullish scenario.
3. “Both” indicates there are SMT divergences at both the highs and lows of candle 2 and candle 3. If an SMT on one side gets deleted, then the cell will automatically update to display the SMT that is still intact.
Note: Equal lows/highs are considered to be a failure swing since it did not sweep the previous candle low/high.
Settings
1. Choose up to three different assets to monitor.
Note: If only two are selected, the indicator will only display the two selected and compare the two assets for divergences. If one is selected, a warning sign will be displayed to select at least two assets.
2. Choose up to four different timeframes. Option to deselect timeframes.
3. Option to enable all alerts or active alerts. Alerts include the different status changes in the table (i.e. Pending, Active, Bullish SMT, Bearish SMT, etc for each or all timeframes).
4. Toggle option to show/hide the table. Toggle option to show/hide the “Title Row” which is the first row at the top of the table.
5. Adjust the table positioning to be displayed on the chart.
6. Option to change text size in the table cells. This will also increase/decrease the size of the table.
7. Table Color Customization gives you options to change the background colors of the cells including text color.
What makes this indicator unique:
1. Track current PSP/TPD status in real-time tick by tick as candles form in multiple timeframes.
2. Track consecutive candle SMT in a 3-candle swing formation in real-time in multiple timeframes.
3. Instead of switching through timeframes to check for PSPs/TPDs, they are consolidated in one table.
Risk Disclaimer
This indicator is for educational and informational purposes only and does not constitute financial advice. All trading and investment decisions remain solely the responsibility of the user.
Trading involves a high degree of risk, and past performance is not indicative of future results.
Always conduct your own research and consult with a qualified financial professional before making any trading decisions.
By using this indicator, users acknowledge they understand these risks and accept full responsibility for their trading decisions and outcomes.
リリースノート
Added Feature: Up arrows and down arrows displayed in the asset column cells. Up and down arrows indicate the final print of the PSP candle (candle 2) for bullish (up arrow) and bearish (down arrow) closes. The cell still displays the current state of the timeframe candle with "bear" and "bull" labels and updates in real-time. However, the up and down arrows are fixed in the cells while TPD status is "Active" and the arrows will clear once the TPD status cells change to "Inactive" or "Pending".招待専用スクリプト
こちらのスクリプトにアクセスできるのは投稿者が承認したユーザーだけです。投稿者にリクエストして使用許可を得る必要があります。通常の場合、支払い後に許可されます。詳細については、以下、作者の指示をお読みになるか、Pogiestに直接ご連絡ください。
スクリプトの機能を理解し、その作者を全面的に信頼しているのでなければ、お金を支払ってまでそのスクリプトを利用することをTradingViewとしては「非推奨」としています。コミュニティスクリプトの中で、その代わりとなる無料かつオープンソースのスクリプトを見つけられる可能性もあります。
作者の指示
To get access please visit website: https://whop.com/pogiest-c457/psp-tpd-smt-indicator-3c/
For further questions, feel free to message me directly here on TradingView.
免責事項
これらの情報および投稿は、TradingViewが提供または保証する金融、投資、取引、またはその他の種類のアドバイスや推奨を意図したものではなく、またそのようなものでもありません。詳しくは利用規約をご覧ください。
招待専用スクリプト
こちらのスクリプトにアクセスできるのは投稿者が承認したユーザーだけです。投稿者にリクエストして使用許可を得る必要があります。通常の場合、支払い後に許可されます。詳細については、以下、作者の指示をお読みになるか、Pogiestに直接ご連絡ください。
スクリプトの機能を理解し、その作者を全面的に信頼しているのでなければ、お金を支払ってまでそのスクリプトを利用することをTradingViewとしては「非推奨」としています。コミュニティスクリプトの中で、その代わりとなる無料かつオープンソースのスクリプトを見つけられる可能性もあります。
作者の指示
To get access please visit website: https://whop.com/pogiest-c457/psp-tpd-smt-indicator-3c/
For further questions, feel free to message me directly here on TradingView.
免責事項
これらの情報および投稿は、TradingViewが提供または保証する金融、投資、取引、またはその他の種類のアドバイスや推奨を意図したものではなく、またそのようなものでもありません。詳しくは利用規約をご覧ください。