INVITE-ONLY SCRIPT
更新済 Sniper BB Scope 9x v2.0
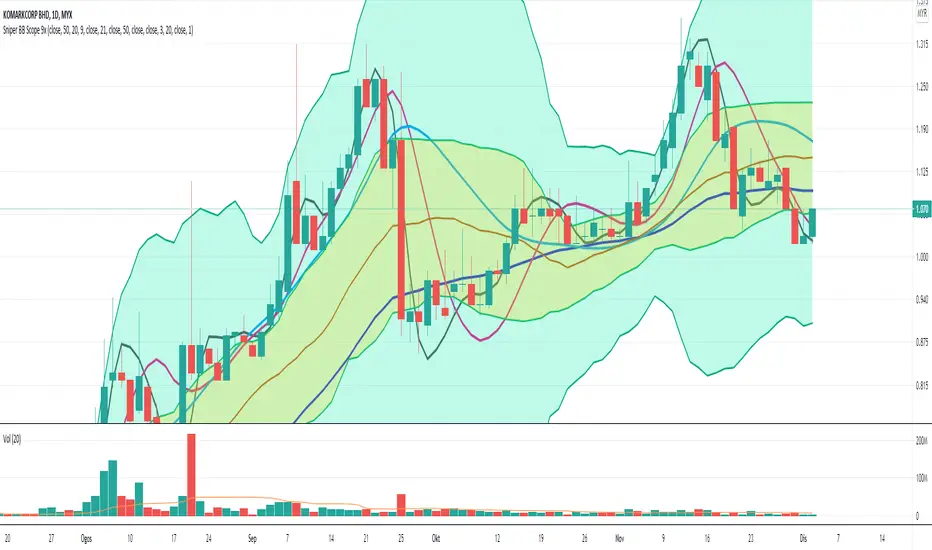
This indicator is combination of two indicators;-
1- BB
2- HMA
Component of BB and the improvement
- combining two BB with different standard deviation that will help trader to identify the range of the price movement. The BB seperate by different colors background so that will help trader to easyly find the price trend.
1. Outer BB - dark green background with dark green line boundaries
- bb breakout with volume if reach the upper bb will have potential to surfing upper BB. But please double confirm with others indi for the momentum. If reach peak, then possible to going back to Upper Inner BB or mid BB.
2. Inner BB - yellow background with light green line boundaries
- can act as nearest support if price going retrace from upper BB. Sometime, the price retrace a bit and making support here before push to higher price.
3. Black line
- cross up candle can buy
- cross down candle can sell
4. Red line
- cross up candle can buy
- cross down candle can sell
5. Blue line act as strong support and resistant for the long term position
- If candle trading below blue line, the blue line will act as resistant.
- If candle trading above blue line, the blue line will act as support.
The signal indication
Strong buy signal
When both black and red line cross up the blue line.
Strong sell signal
When both black and red line line cross down the blue line.
リリースノート
update - revised more accurate multiple hma calculation
リリースノート
Adding lag hma 50招待専用スクリプト
このスクリプトは作者が承認したユーザーのみアクセス可能です。使用するにはアクセス申請をして許可を得る必要があります。通常は支払い後に承認されます。詳細は下記の作者の指示に従うか、bids_sniperに直接お問い合わせください。
TradingViewは、作者を完全に信頼し、スクリプトの動作を理解していない限り、有料スクリプトの購入・使用を推奨しません。コミュニティスクリプトには無料のオープンソースの代替が多数あります。
作者の指示
免責事項
この情報および投稿は、TradingViewが提供または推奨する金融、投資、トレード、その他のアドバイスや推奨を意図するものではなく、それらを構成するものでもありません。詳細は利用規約をご覧ください。
招待専用スクリプト
このスクリプトは作者が承認したユーザーのみアクセス可能です。使用するにはアクセス申請をして許可を得る必要があります。通常は支払い後に承認されます。詳細は下記の作者の指示に従うか、bids_sniperに直接お問い合わせください。
TradingViewは、作者を完全に信頼し、スクリプトの動作を理解していない限り、有料スクリプトの購入・使用を推奨しません。コミュニティスクリプトには無料のオープンソースの代替が多数あります。
作者の指示
免責事項
この情報および投稿は、TradingViewが提供または推奨する金融、投資、トレード、その他のアドバイスや推奨を意図するものではなく、それらを構成するものでもありません。詳細は利用規約をご覧ください。