PROTECTED SOURCE SCRIPT
Custum Deviation + xEMA_DFMA alpha
This indicator is still an alpha version.
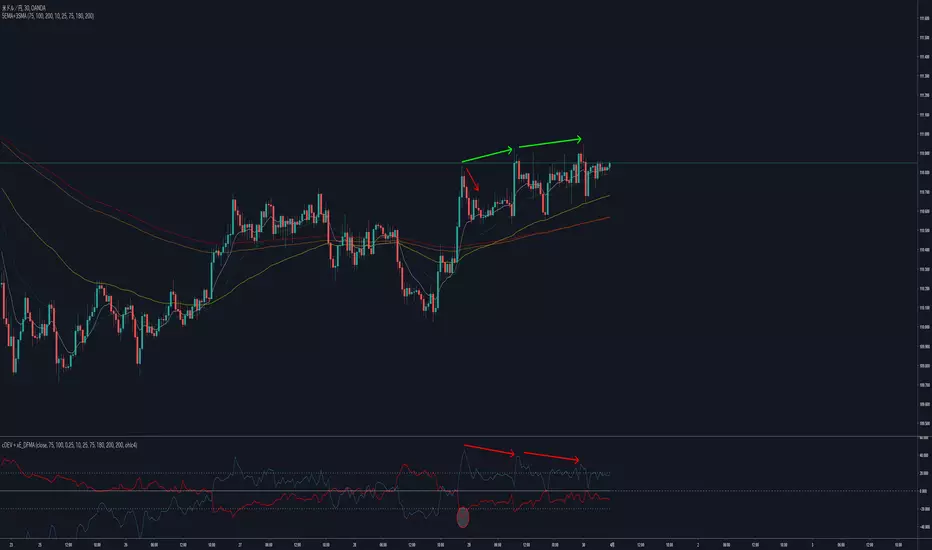
This indicator shows you that deviation from specific EMA (Red Line). It can help you to do Countertrade when price "skyrockets" or "Sudden drop".
Blue Line show you that sum of difference from Moving Average of 5 types EMAs. It shows "Divergence" like MACD.
This indicator shows you that deviation from specific EMA (Red Line). It can help you to do Countertrade when price "skyrockets" or "Sudden drop".
Blue Line show you that sum of difference from Moving Average of 5 types EMAs. It shows "Divergence" like MACD.
保護スクリプト
このスクリプトのソースコードは非公開で投稿されています。 ただし、制限なく自由に使用できます – 詳細はこちらでご確認ください。
免責事項
この情報および投稿は、TradingViewが提供または推奨する金融、投資、トレード、その他のアドバイスや推奨を意図するものではなく、それらを構成するものでもありません。詳細は利用規約をご覧ください。
免責事項
この情報および投稿は、TradingViewが提供または推奨する金融、投資、トレード、その他のアドバイスや推奨を意図するものではなく、それらを構成するものでもありません。詳細は利用規約をご覧ください。