OPEN-SOURCE SCRIPT
更新済 [blackcat] L1 Reverse Choppiness Index
The Choppiness Index is a technical indicator that is used to measure market volatility and trendiness. It is designed to help traders identify when the market is trending and when it is choppy, meaning that it is moving sideways with no clear direction. The Choppiness Index was first introduced by Australian commodity trader E.W. Dreiss in the late 1990s, and it has since become a popular tool among traders.
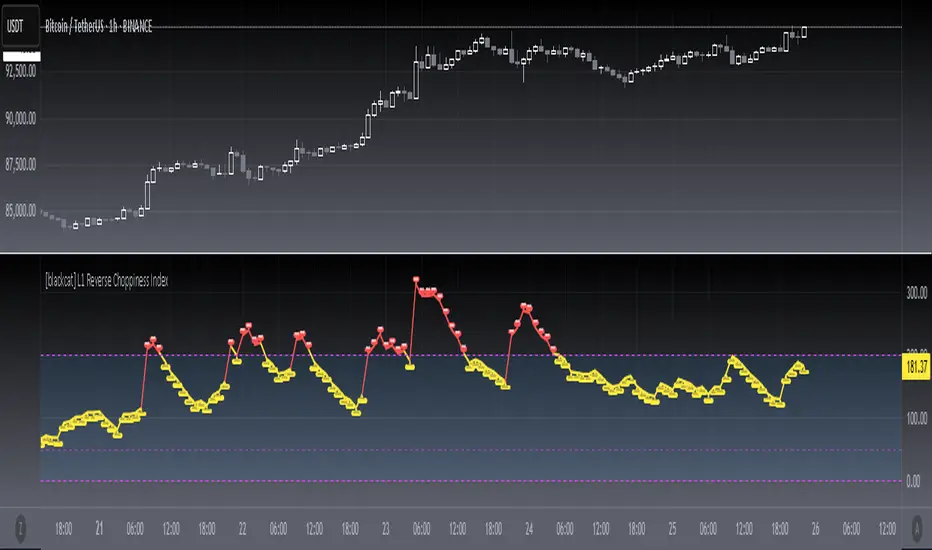
Today, I created a reverse version of choppiness index indicator, which uses upward direction as indicating strong trend rather than a traditional downward direction. Also, it max values are exceeding 100 compared to a traditional one. I use red color to indicate a strong trend, while yellow as sideways. Fuchsia zone are also incorporated as an indicator of sideways. One thing that you need to know: different time frames may need optimize parameters of this indicator. Finally, I'd be happy to explain more about this piece of code.
The code begins by defining two input variables: `len` and `atrLen`. `len` sets the length of the lookback period for the highest high and lowest low, while `atrLen` sets the length of the lookback period for the ATR calculation.
The `atr()` function is then used to calculate the ATR, which is a measure of volatility based on the range of price movement over a certain period of time. The `highest()` and `lowest()` functions are used to calculate the highest high and lowest low over the lookback period specified by `len`.
The `range`, `up`, and `down` variables are then calculated based on the highest high, lowest low, and closing price. The `sum()` function is used to calculate the sum of ranges over the lookback period.
Finally, the Choppiness Index is calculated using the ATR and the sum of ranges over the lookback period. The `log10()` function is used to take the logarithm of the sum divided by the lookback period, and the result is multiplied by 100 to get a percentage. The Choppiness Index is then plotted on the chart using the `plot()` function.
This code can be used directly in TradingView to plot the Choppiness Index on a chart. It can also be incorporated into custom trading strategies to help traders make more informed decisions based on market volatility and trendiness.
I hope this explanation helps! Let me know if you have any further questions.
リリースノート
upgrade to v5リリースノート
OVERVIEWThe [blackcat] L1 Reverse Choppiness Index is a unique technical indicator designed to help traders identify periods of trending and ranging market conditions. By analyzing Average True Range (ATR) and price movements over a specified period, this indicator provides insights into market volatility and directionality. It plots a custom Reverse Choppiness Index alongside bands to visually represent market states, helping traders make informed decisions 📊💹.
FEATURES
Calculates a custom Reverse Choppiness Index based on ATR and price ranges:
Length: Period for calculating highest highs and lowest lows.
ATR Length: Period for calculating Average True Range.
Chop Threshold: Level above which the market is considered trending.
Plots the Reverse Choppiness Index line with dynamic coloring:
Yellow when below the chop threshold (sideways market).
Red when above the chop threshold (trending market).
Includes upper, middle, and lower bands for better context:
Upper Band: Set by the chop threshold level (fuchsia dashed line).
Middle Band: Fixed at 50 level (gray solid line).
Lower Band: Fixed at 0 level (fuchsia dashed line).
Displays "Trend" and "Sideways" labels on the chart for quick identification 🏷️
HOW TO USE
Add the indicator to your TradingView chart by selecting it from the indicators list.
Adjust the Length, ATR Length, and Chop Threshold parameters to suit your preferences ⚙️.
Monitor the chart for "Trend" and "Sideways" labels indicating current market conditions.
Use the colored index line and bands as additional context for market sentiment analysis.
LIMITATIONS
The indicator may not capture all nuances of complex market structures.
False signals can occur in highly volatile or transitional markets 🌪️.
Users should always confirm signals with other forms of analysis.
NOTES
Ensure that you have sufficient historical data available for accurate calculations.
Test the indicator thoroughly on demo accounts before applying it to live trading 🔍.
Customize the appearance and parameters as needed to fit your trading strategy.
オープンソーススクリプト
TradingViewの精神に則り、このスクリプトの作者はコードをオープンソースとして公開してくれました。トレーダーが内容を確認・検証できるようにという配慮です。作者に拍手を送りましょう!無料で利用できますが、コードの再公開はハウスルールに従う必要があります。
Avoid losing contact!Don't miss out! The first and most important thing to do is to join my Discord chat now! Click here to start your adventure: discord.com/invite/ZTGpQJq 防止失联,请立即行动,加入本猫聊天群: discord.com/invite/ZTGpQJq
免責事項
この情報および投稿は、TradingViewが提供または推奨する金融、投資、トレード、その他のアドバイスや推奨を意図するものではなく、それらを構成するものでもありません。詳細は利用規約をご覧ください。