PROTECTED SOURCE SCRIPT
更新済 Bitcoin SOPR Heatmap
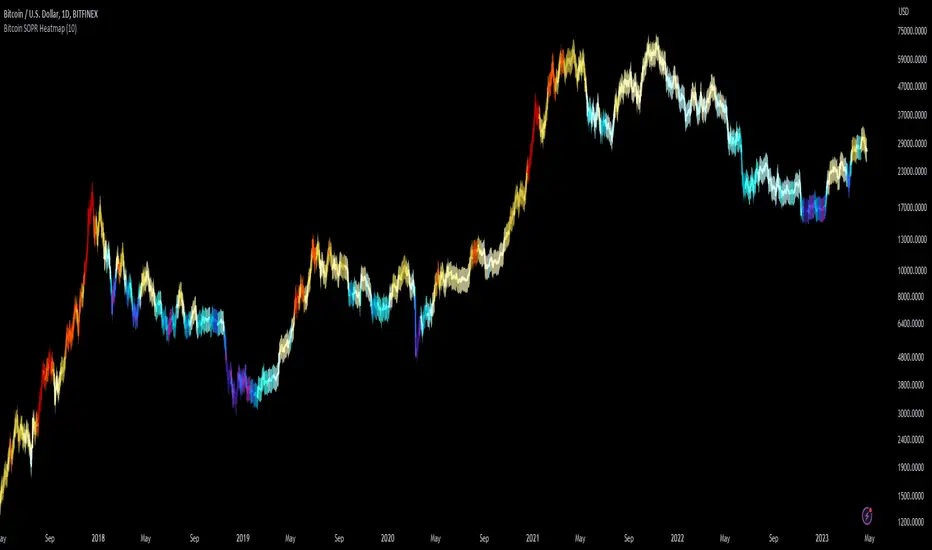
SOPR (spent output profit ratio) is a metric, provided by Glassnode to measure if most BTC are moved in profit or in loss. The higher SOPR is, the more profits are realized (theoretically) and vice versa.
This indicator shows SOPR visually as a heatmap directly on the Bitcoin chart.
Cold temperatures (blue, purple) show bear markets. Bear market peaks should be visible in dark purple.
Hot temperatues (yellow, red) show bull markets. Hype phases should be visible in red.
I recommend to hide chart when using the indicator. Otherwise you can also enlarge the heatmap in the settings.
The indicator works best on BTCUSD standard charts on daily timeframe. Otherwise you will see an error message.
リリースノート
- Code error fixed
保護スクリプト
このスクリプトのソースコードは非公開で投稿されています。 ただし、制限なく自由に使用できます – 詳細はこちらでご確認ください。
We build Bitcoin and crypto algorithms with the intention to outperform.
Check out our website to see more of our work.
Check out our website to see more of our work.
免責事項
この情報および投稿は、TradingViewが提供または推奨する金融、投資、トレード、その他のアドバイスや推奨を意図するものではなく、それらを構成するものでもありません。詳細は利用規約をご覧ください。