PROTECTED SOURCE SCRIPT
更新済 Best Liquidity Indicator v0.6.3
Best Liquidity Indicator (BLI)
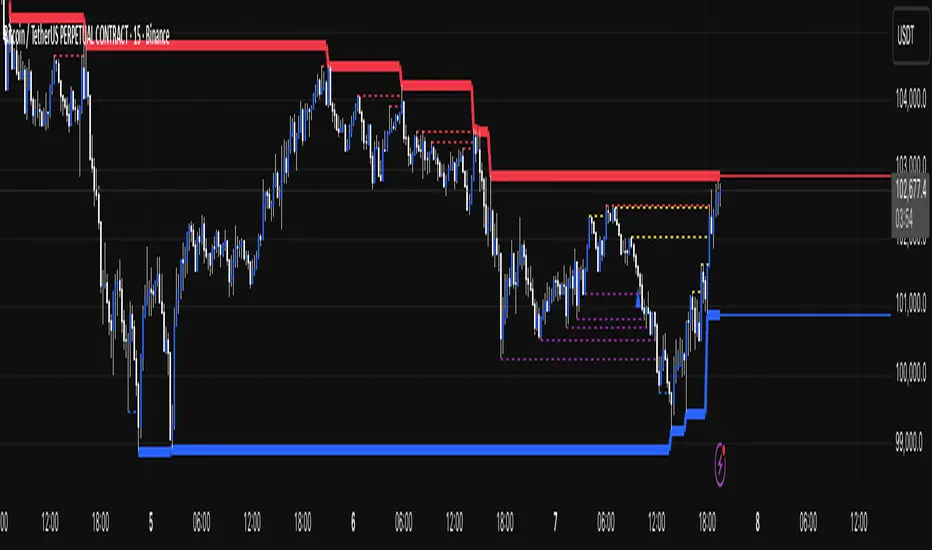
BLI maps where liquidity typically sits—and when it gets taken. It automatically draws:
BLI maps where liquidity typically sits—and when it gets taken. It automatically draws:
- Sell-side liquidity (SSL) levels and Buy-side liquidity (BSL) levels
- Liquidity grabs when price runs a level
- Ex-liquidity (invalidated/older grabs) to show the evolving path of least resistance
- (Optional) Liquidity Rails: continuous, flat “stairs” that follow only active liquidity levels to give you a smooth, higher-level read of the market’s liquidity envelope
- (Optional) the same logic from a higher timeframe (e.g., 4H) overlaid on your current chart
リリースノート
- Fixed issues preventing HTF liquidity levels from showing on the chart.
- Made Improvements to the Liquidity rail lines. (Further improvements to come in next version.
保護スクリプト
このスクリプトのソースコードは非公開で投稿されています。 しかし、無料かつ制限なしでご利用いただけます ― 詳細についてはこちらをご覧ください。
免責事項
これらの情報および投稿は、TradingViewが提供または保証する金融、投資、取引、またはその他の種類のアドバイスや推奨を意図したものではなく、またそのようなものでもありません。詳しくは利用規約をご覧ください。
保護スクリプト
このスクリプトのソースコードは非公開で投稿されています。 しかし、無料かつ制限なしでご利用いただけます ― 詳細についてはこちらをご覧ください。
免責事項
これらの情報および投稿は、TradingViewが提供または保証する金融、投資、取引、またはその他の種類のアドバイスや推奨を意図したものではなく、またそのようなものでもありません。詳しくは利用規約をご覧ください。