PROTECTED SOURCE SCRIPT
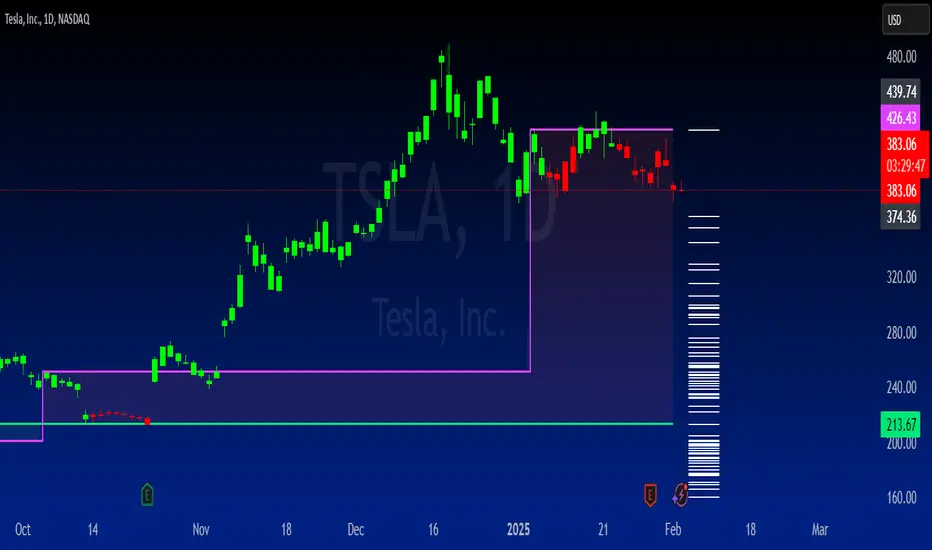
Midgar's DikFat Dynamic Support and Resistance
Midgar Heiken-Ashi Commission Indicator
This indicator is a leading indicator designed to identify key price levels and potential support/resistance zones using Heiken-Ashi calculations. It provides visual aids such as dynamic support/resistance lines, price labels, and percentage distance tags to help traders interpret market structure more effectively.
How It Works:
1. Heiken-Ashi Calculation
- The indicator constructs Heiken-Ashi values based on standard formulas.
- The open price is smoothed using prior Heiken-Ashi values to maintain continuity.
2. Dynamic Support & Resistance (S/R) Detection
- Identifies "sandwich" Heiken-Ashi candles (specific bullish or bearish patterns).
- Plots dynamic support and resistance levels based on these key candles.
- Two sets of support/resistance lines are available:
- Primary Dynamic S/R (based on strong HA reversals).
- Companion Indicator Dynamic S/R (a secondary validation layer).
3. Customizable Visualization
- Infinite or right-extended support/resistance lines.
- Price labels at key levels (optional).
- Custom background color highlighting for detected S/R areas.
- Adjustable transparency settings for improved chart clarity.
4. Percentage Distance Calculation
- Calculates the percentage difference between detected support and resistance levels.
- Optionally displays distance tags for quick reference.
Important Notes:
- This is a leading indicator. It aims to highlight potential future support and resistance areas rather than reacting to past movements.
- Recommended for use on a candlestick chart. Using it on a other chart types may produce unintended results.
- No single indicator should be relied upon for trading decisions. Always use multiple forms of analysis and risk management strategies.
- Trading results are never guaranteed. Past performance does not predict future results, and all trading involves risk.
This indicator provides a structured view of market behavior using Heiken-Ashi principles, helping traders visualize potential support and resistance zones more effectively.
保護スクリプト
このスクリプトのソースコードは非公開で投稿されています。 ただし、制限なく自由に使用できます – 詳細はこちらでご確認ください。
All opinions while deemed valid by its operators and shared on this board are not financial advice and are primarily for Entertainment Purposes.
免責事項
この情報および投稿は、TradingViewが提供または推奨する金融、投資、トレード、その他のアドバイスや推奨を意図するものではなく、それらを構成するものでもありません。詳細は利用規約をご覧ください。