PROTECTED SOURCE SCRIPT
更新済 Six Sigma Enhanced
This script is a study of the Two Six Sigma patterns explored in the December 2018 issue of Technical Analysis of Stocks & Commodities (Stocks & Commodities V. 36:12 (8–12): Identifying High-Probability Buy Signals by François Picard, MS , & Edmond Miresco, PhD )
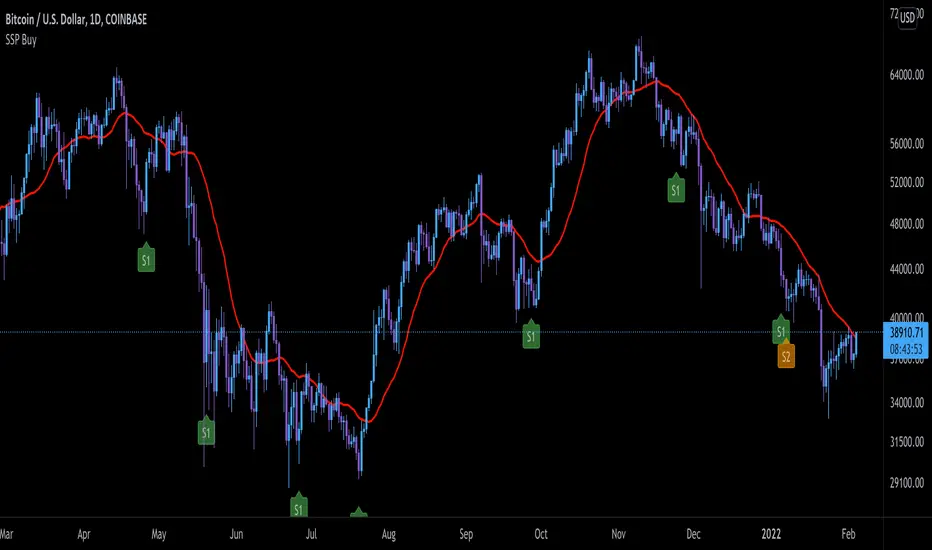
Signal 1 - 9 Closes Under MA
The first (Signal #1 or S1 on the chart) indicates 9 consecutive closes below the 20-period moving average. In the study, the authors used a simple moving average however I have modified it to use a MA to account for price distribution
Signal 2 - 6 Lower Closes and 9 Closes Under MA
The second signal (Signal #2 or S2 on the chart) indicates six consecutive periods where the close value is lower than the previous close and Signal 1.
Filter Signal Code provided by tradingview.com/u/AllTradeSignals/
リリースノート
SMA is used to calculate plot lineリリースノート
migrated to v5保護スクリプト
このスクリプトのソースコードは非公開で投稿されています。 ただし、制限なく自由に使用できます – 詳細はこちらでご確認ください。
免責事項
この情報および投稿は、TradingViewが提供または推奨する金融、投資、トレード、その他のアドバイスや推奨を意図するものではなく、それらを構成するものでもありません。詳細は利用規約をご覧ください。
免責事項
この情報および投稿は、TradingViewが提供または推奨する金融、投資、トレード、その他のアドバイスや推奨を意図するものではなく、それらを構成するものでもありません。詳細は利用規約をご覧ください。