INVITE-ONLY SCRIPT
ZenAlgo - Mars
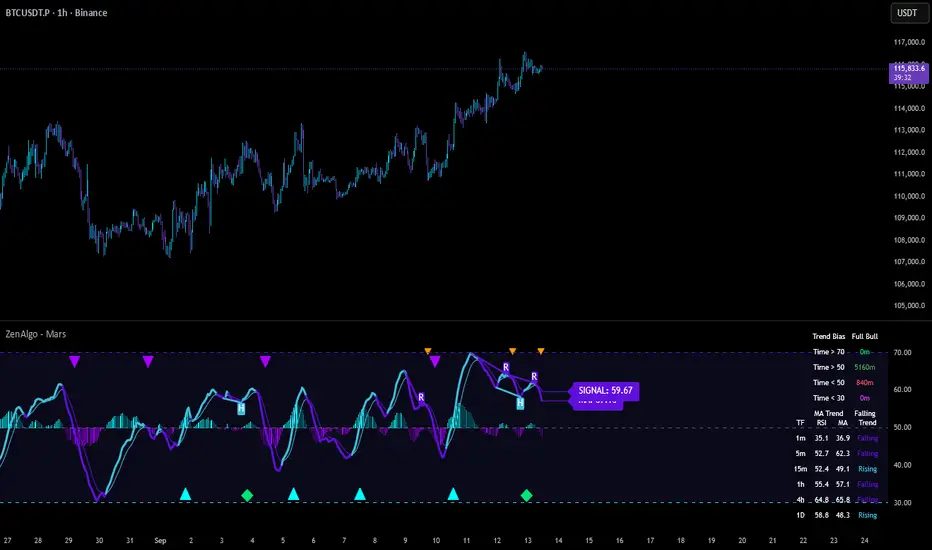
This indicator is a momentum-based oscillator built around a modified RSI calculation and subsequent smoothing with moving averages. It introduces a layered structure where divergences, signal crossovers, histogram dynamics, and multi-timeframe tables all combine into a comprehensive framework. The purpose is not to forecast markets with certainty but to provide structured context on momentum shifts, divergences, and trend bias.
Core Calculation
Why this structure:
RSI captures momentum imbalance between gains and losses. Smoothing removes noise and makes divergences more stable to identify. Adding a signal line allows crossover events to highlight relative strengthening or weakening momentum phases.
Zones and Visual Guides
Why these levels:
Values above 70 or below 30 are commonly interpreted as overextended regions. A central 50 line separates positive from negative bias. These anchors allow consistent interpretation of oscillator movements.
Crossover Events
Divergence Detection
* Divergences are calculated on the smoothed MA rather than raw RSI.
Four conditions are tracked:
Each detected divergence is marked with shapes and labeled "R" (regular) or "H" (hidden).
Why divergences are used:
They highlight when oscillator momentum disagrees with price structure. Regular divergences often suggest exhaustion, while hidden divergences may appear during continuation phases.
RSI & MA Multi-Timeframe Table
Added value:
Instead of analyzing divergences or crossovers only on one chart, the table provides a compact overview of aligned or conflicting conditions across timeframes.
Strong and Warning Indications
Why this distinction:
Hidden divergences often accompany continuation phases, while regular divergences may challenge the prevailing bias. Marking them separately allows the user to distinguish between potential trend reinforcement versus warning conditions.
Signal Table
A separate table summarizes:
Time in Zones
The indicator measures how many bars (converted into minutes) the MA has spent:
Why this matters:
Extended time in an extreme zone can show persistent momentum. Quick reversals versus sustained positioning give different context for bias strength.
MA vs Signal Histogram
Daily VWAP Integration
Why VWAP is included:
VWAP serves as an intraday mean reference. Requiring alignment between oscillator momentum and price position relative to VWAP reduces random crossover noise.
Added Value Over Free Indicators
Limitations and Disclaimers
How to Interpret Values
Best Use
Core Calculation
- The base source is the closing price.
- From it, relative upward and downward movements are measured over a chosen lookback length (by preset or manual input).
- These values are normalized into an oscillator bounded between 0–100, equivalent to a traditional RSI structure.
- This oscillator is smoothed by a moving average (SMA by default), producing the main line (MA).
- A secondary smoothing (EMA by default) of the MA produces a signal line, against which crossovers are monitored.
Why this structure:
RSI captures momentum imbalance between gains and losses. Smoothing removes noise and makes divergences more stable to identify. Adding a signal line allows crossover events to highlight relative strengthening or weakening momentum phases.
Zones and Visual Guides
- Static horizontal levels are placed at 70 (upper bound), 50 (mid-line), and 30 (lower bound).
- The region between 30–70 is softly filled to emphasize the neutral zone.
- Color changes on the MA line occur depending on whether it is above or below the signal line.
Why these levels:
Values above 70 or below 30 are commonly interpreted as overextended regions. A central 50 line separates positive from negative bias. These anchors allow consistent interpretation of oscillator movements.
Crossover Events
- Alerts and conditions are defined for when the MA crosses above or below the signal line.
- These are not entry signals by themselves but indicate shifts in relative momentum strength.
Divergence Detection
* Divergences are calculated on the smoothed MA rather than raw RSI.
Four conditions are tracked:
- Regular bullish (price makes a lower low while MA makes a higher low).
- Hidden bullish (price higher low with MA lower low).
- Regular bearish (price higher high with MA lower high).
- Hidden bearish (price lower high with MA higher high).
Each detected divergence is marked with shapes and labeled "R" (regular) or "H" (hidden).
Why divergences are used:
They highlight when oscillator momentum disagrees with price structure. Regular divergences often suggest exhaustion, while hidden divergences may appear during continuation phases.
RSI & MA Multi-Timeframe Table
- A table can be displayed showing RSI and MA values across multiple timeframes (1m, 5m, 15m, 1h, 4h, 1D).
- For each, the relationship (Rising, Falling, Neutral) is determined by comparing RSI and MA.
- Colors are adjusted depending on value ranges (extreme low, oversold, overbought, etc.).
Added value:
Instead of analyzing divergences or crossovers only on one chart, the table provides a compact overview of aligned or conflicting conditions across timeframes.
Strong and Warning Indications
- "Strong" mark (Diamond) appear when the MA is firmly biased above or below 50 and hidden divergence supports the trend.
- "Warning" mark (Triangle) appear when bias is strong but a regular divergence forms in the opposite direction.
- Shapes mark these conditions, and alerts are available.
Why this distinction:
Hidden divergences often accompany continuation phases, while regular divergences may challenge the prevailing bias. Marking them separately allows the user to distinguish between potential trend reinforcement versus warning conditions.
Signal Table
A separate table summarizes:
- Overall trend bias (Bull, Full Bull, Bear, Full Bear, Flat).
- Time spent in each key zone.
- Current MA trend (Rising, Falling, Flat).
- Visual icons and color codes provide quick interpretation.
Time in Zones
The indicator measures how many bars (converted into minutes) the MA has spent:
- above 70
- above 50
- below 50
- below 30
- These values appear in the signal table.
Why this matters:
Extended time in an extreme zone can show persistent momentum. Quick reversals versus sustained positioning give different context for bias strength.
MA vs Signal Histogram
- A histogram plots the difference between MA and signal line, shifted around the 50 level.
- Rising differences are shown with brighter coloring, falling differences with faded tones.
- This emphasizes whether momentum is accelerating or decelerating.
Daily VWAP Integration
- When the MA crosses the 50 level, additional conditions check whether the histogram is aligned and whether price is above or below the daily VWAP.
- Only when both momentum bias and VWAP alignment agree are triangle markers shown.
Why VWAP is included:
VWAP serves as an intraday mean reference. Requiring alignment between oscillator momentum and price position relative to VWAP reduces random crossover noise.
Added Value Over Free Indicators
- Divergences are calculated on smoothed momentum rather than raw RSI, reducing false positives.
- Integration of multi-timeframe tables avoids the need to manually switch charts.
- Bias measurement in terms of time spent in zones adds a temporal dimension often missing in basic oscillators.
- Combining histogram dynamics with VWAP filtering provides context not present in typical RSI or MA overlays.
Limitations and Disclaimers
- Divergences are not predictive on their own; price may continue without respecting them.
- Extreme readings (e.g., above 70) can remain extended for long periods, especially in strong trends.
- Multi-timeframe aggregation may introduce repainting effects when lower timeframes update faster than higher ones.
- Signals must be interpreted in broader market context; the indicator does not provide trade entries or exits by itself.
How to Interpret Values
- Above 70: momentum is strongly stretched upward.
- Below 30: momentum is strongly stretched downward.
- Crossing 50: often marks a structural change in directional bias.
- MA rising vs. falling: tracks whether momentum pressure is increasing or decreasing.
- Divergence labels: "R" = potential reversal, "H" = potential continuation.
- Tables: confirm whether bias is consistent across multiple timeframes.
Best Use
- Observe divergences in conjunction with bias tables to understand whether short-term moves align with higher-timeframe conditions.
- Treat "Strong" and "Warning" markers as contextual alerts, not direct signals.
- Use the histogram and VWAP alignment to filter out weaker crossovers.
- Combine with price action and risk management rather than using in isolation.
招待専用スクリプト
このスクリプトは作者が承認したユーザーのみアクセス可能です。使用するにはアクセス申請をして許可を得る必要があります。通常は支払い後に承認されます。詳細は下記の作者の指示に従うか、ZenAlgo_Officialに直接お問い合わせください。
TradingViewは、作者を完全に信頼し、スクリプトの動作を理解していない限り、有料スクリプトの購入・使用を推奨しません。コミュニティスクリプトには無料のオープンソースの代替が多数あります。
作者の指示
Get access here: https://zenalgo.io
The ZenAlgo team
zenalgo.com
discord.zenalgo.com
zenalgo.com
discord.zenalgo.com
免責事項
この情報および投稿は、TradingViewが提供または推奨する金融、投資、トレード、その他のアドバイスや推奨を意図するものではなく、それらを構成するものでもありません。詳細は利用規約をご覧ください。