INVITE-ONLY SCRIPT
Cup and Handle Indicator
This is a Cup and Handle Indicator. Features include:
The functionality of this indicator is very similar to my double top indicator, and inherits majority of the settings/inputs. Please try that indicator before using this one.
From Wikipedia: In the domain of technical analysis of market prices, a cup and handle or cup with handle formation is a chart pattern consisting of a drop in the price and a rise back up to the original value, followed first by a smaller drop and then a rise past the previous peak.[1] It is interpreted as an indication of bullish sentiment in the market and possible further price increases.[2]
The cup part of the pattern should be fairly shallow, with a rounded or flat "bottom" (not a V-shaped one), and ideally reach to the same price at the upper end of both sides. The drop of the handle part should retrace about 30% to 50% of the rise at the end of the cup. For stock prices, the pattern may span from a few weeks to a few years; but commonly the cup lasts from 1 to 6 months, while the handle should only last for 1 to 4 weeks.[3]
The "cup and handle" formation was defined by William O'Neil"[2][4]
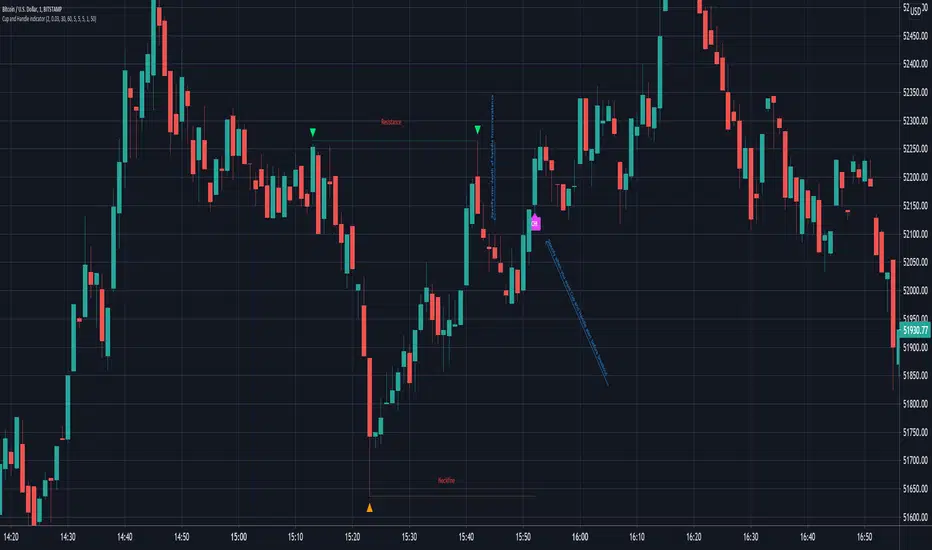
Key settings to note compared to my double top indicator are highlighted in following image

PM me to obtain access
Best regards.
- Can set alert at any point after handle starts rising before breakout
- Can detect multiple tops before confirming cup and handle pattern, not just double.
- Many settings to adjust to meet your exact requirements
The functionality of this indicator is very similar to my double top indicator, and inherits majority of the settings/inputs. Please try that indicator before using this one.
From Wikipedia: In the domain of technical analysis of market prices, a cup and handle or cup with handle formation is a chart pattern consisting of a drop in the price and a rise back up to the original value, followed first by a smaller drop and then a rise past the previous peak.[1] It is interpreted as an indication of bullish sentiment in the market and possible further price increases.[2]
The cup part of the pattern should be fairly shallow, with a rounded or flat "bottom" (not a V-shaped one), and ideally reach to the same price at the upper end of both sides. The drop of the handle part should retrace about 30% to 50% of the rise at the end of the cup. For stock prices, the pattern may span from a few weeks to a few years; but commonly the cup lasts from 1 to 6 months, while the handle should only last for 1 to 4 weeks.[3]
The "cup and handle" formation was defined by William O'Neil"[2][4]
Key settings to note compared to my double top indicator are highlighted in following image
PM me to obtain access
Best regards.
招待専用スクリプト
こちらのスクリプトにアクセスできるのは投稿者が承認したユーザーだけです。投稿者にリクエストして使用許可を得る必要があります。通常の場合、支払い後に許可されます。詳細については、以下、作者の指示をお読みになるか、fluffykatに直接ご連絡ください。
スクリプトの機能を理解し、その作者を全面的に信頼しているのでなければ、お金を支払ってまでそのスクリプトを利用することをTradingViewとしては「非推奨」としています。コミュニティスクリプトの中で、その代わりとなる無料かつオープンソースのスクリプトを見つけられる可能性もあります。
作者の指示
PM me to obtain access
免責事項
これらの情報および投稿は、TradingViewが提供または保証する金融、投資、取引、またはその他の種類のアドバイスや推奨を意図したものではなく、またそのようなものでもありません。詳しくは利用規約をご覧ください。