PROTECTED SOURCE SCRIPT
更新済 UDI Directional Lines 5/20ema
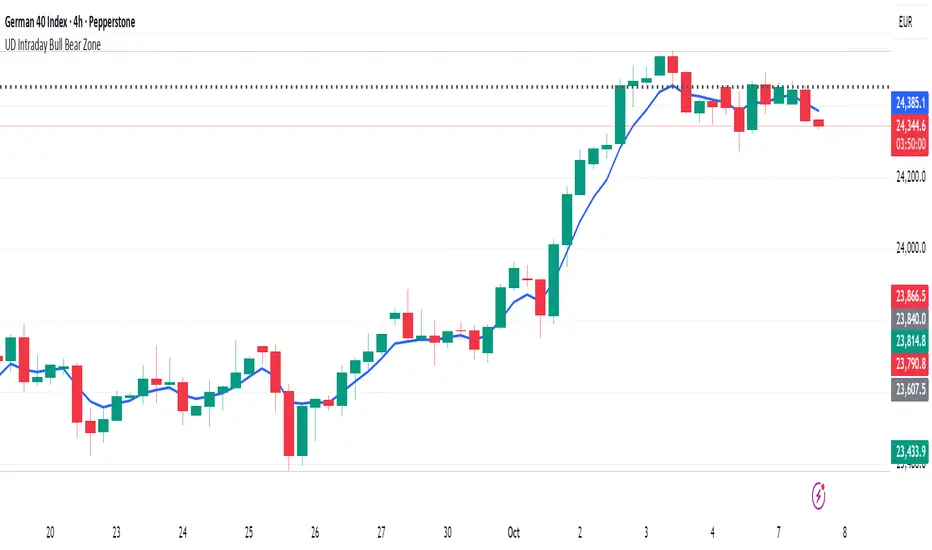
This indicator indicates the use of ema lines to determine the change of directions where:
- 5ema black line indicates small trend shift
- 20ema red line indicates big trend shift
On top of it the circles below the chart shows the momentum to execute where
- green indicates bull trend and cycle
- red indicates red trend and cycle
With the combination of direction and momentum there will be more accuracy in tracking the trend movement of a particular asset
リリースノート
The blue line is the line that indicates the bull bear zone of the intraday movement where candle closing above is entering Bull and Below is entering Bear保護スクリプト
このスクリプトのソースコードは非公開で投稿されています。 ただし、制限なく自由に使用できます – 詳細はこちらでご確認ください。
Ups and Downs by Entreuverse
免責事項
この情報および投稿は、TradingViewが提供または推奨する金融、投資、トレード、その他のアドバイスや推奨を意図するものではなく、それらを構成するものでもありません。詳細は利用規約をご覧ください。
保護スクリプト
このスクリプトのソースコードは非公開で投稿されています。 ただし、制限なく自由に使用できます – 詳細はこちらでご確認ください。
Ups and Downs by Entreuverse
免責事項
この情報および投稿は、TradingViewが提供または推奨する金融、投資、トレード、その他のアドバイスや推奨を意図するものではなく、それらを構成するものでもありません。詳細は利用規約をご覧ください。