INVITE-ONLY SCRIPT
更新済 (CD|RS Signal) Caruso Divergence Relative Strength Signal
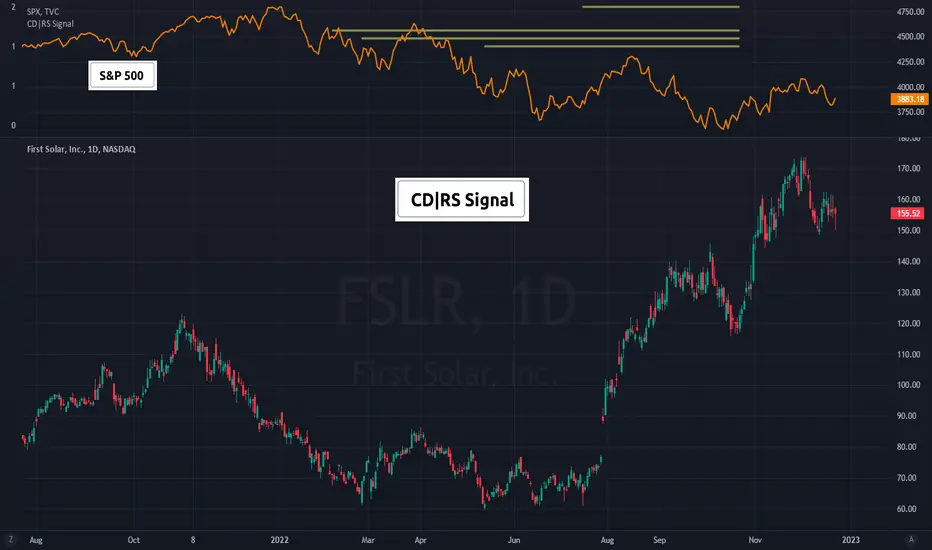
CD|RS Signal allows for plotting horizontal bars to isolate periods where a security is forming a positive divergence from its benchmark, therefore, producing positive Relative strength when accounting for the security's volatility.
Investors can set how many 'pivots' or lows back to use when making an analysis. CD|RS Signal has an algorithm to identify pats market lows and automatically line them up with a stock's low around the same period of time. This allows for divergence analysis across many past lows and helps to isolate positive price divergences that are not so clear in choppy sideways trading action. CD|RS Signal helps an investor to identify when a security does not make a lower low vs a benchmark that has made a lower low over a similar period.
To help visualize the meaning behind the indicator, CD|RS Signal can be plotted in a separate pane, ideally over the benchmark itself. Traditionally the S&P500 is used for US stock analysis. By overlaying CD|RS Signal over the S&P 500, investors can more easily view which S&P 500 lows the stock is currently showing a positive divergence with.
This indicator allows you to select both your benchmark for comparing against as investors may prefer a commodity crypto currency or another stock. As well, users cans elect as far back to make the analysis by selecting the pivot lookback (how many prior ‘pivots’ or ‘market lows’ back to compare against).
In addition, to perform the historical study, investors can turn on historical HLs in the settings enabling all past CD|RS signals to show. This helps an investor to visualize how this has functioned on a security in the past.
リリースノート
Version 2.0■ Support for all symbol types.
■ Add option to change RT line color and width.
招待専用スクリプト
このスクリプトは作者が承認したユーザーのみアクセス可能です。使用するにはアクセス申請をして許可を得る必要があります。通常は支払い後に承認されます。詳細は下記の作者の指示に従うか、CarusoInsightsに直接お問い合わせください。
TradingViewは、作者を完全に信頼し、スクリプトの動作を理解していない限り、有料スクリプトの購入・使用を推奨しません。コミュニティスクリプトには無料のオープンソースの代替が多数あります。
作者の指示
Get access to CarusoInsights indicators: https://www.carusoinsights.com/charting/
Get access to CarusoInsights indicators: carusoinsights.com/charting/
免責事項
この情報および投稿は、TradingViewが提供または推奨する金融、投資、トレード、その他のアドバイスや推奨を意図するものではなく、それらを構成するものでもありません。詳細は利用規約をご覧ください。