PROTECTED SOURCE SCRIPT
Artharjan Day Trading Range
Hi,
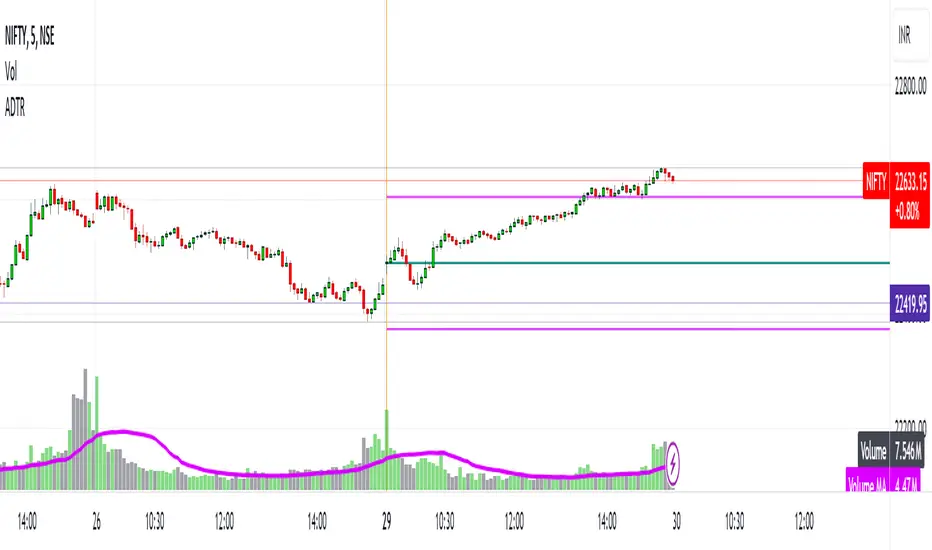
I have created Artharjan Day Trading Range indicator that plots the Intraday Trading Range for the day based on past 5 Days ATR value and takes 50% of that value and plots it above and below the current day's opening price. If current day close crosses above the Upper Level then we may see a Bullish trend otherwise Bearish trend can be seen. If the price trades between these two levels then options writers can write the Call options above Upper Level and Put options below Lower Levels.
I hope traders would love to use this script for trading Options.
Regards
Rrahul Desai
Artharjan
保護スクリプト
このスクリプトのソースコードは非公開で投稿されています。 ただし、制限なく自由に使用できます – 詳細はこちらでご確認ください。
I am a professional trader and have passion for teaching and programming. In case anyone is interested to know more then feel to drop me a line at rahul30m@gmail.com / +91-9136096161
免責事項
この情報および投稿は、TradingViewが提供または推奨する金融、投資、トレード、その他のアドバイスや推奨を意図するものではなく、それらを構成するものでもありません。詳細は利用規約をご覧ください。