INVITE-ONLY SCRIPT
ZynAlgo S&R Pro
ZynAlgo S&R Pro™ automatically identifies high-probability support and resistance zones by detecting swing highs and lows, visualizing liquidity areas where large market participants are likely active.
The indicator dynamically draws and updates these levels in real time, providing traders with an instant map of market structure — where price is most likely to react, reverse, or break through.
It’s built for traders who rely on structure-based trading, smart money concepts (SMC), and liquidity-based analysis, offering a clean, efficient, and objective way to view market levels without manual charting.
⚙️ CORE CONCEPT
Markets move through cycles of liquidity — sweeping previous highs and lows before establishing new structure.
S&R Pro captures these key points automatically, creating clear horizontal levels that represent potential liquidity zones and high-probability reaction areas.
Every zone is drawn dynamically using confirmed swing highs and lows, ensuring that the indicator adapts to evolving price action while keeping your charts clean and uncluttered.
🧩 FEATURES
Automatic Detection of swing highs/lows based on user-defined sensitivity
Liquidity Pool Visualization for both buy-side and sell-side zones
Dynamic Extension Lines that update until new structure forms
Customizable Styling: color, line width, and line type
Candle Coloring System to enhance visual clarity of price action
Smart Alerts for liquidity sweeps and swing confirmations
Lightweight & Fast Rendering — optimized for all market types
🧠 HOW TO USE
Add the indicator to your chart and adjust “Left/Right Bar” to control how sensitive swing detection is.
Liquidity lines (red for buy-side, blue for sell-side) will automatically appear and extend until new structure is formed.
Watch how price interacts with these lines — reactions often occur near recent liquidity zones.
Combine with your existing confluence tools such as trend dashboards or volume filters to refine entries and exits.
Set alerts for when liquidity zones are reached or when new swing points form.
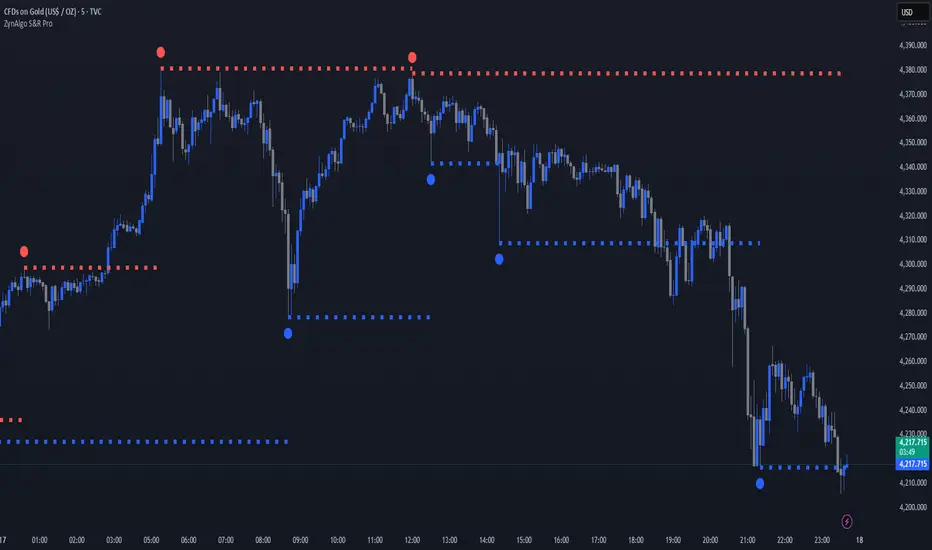
📊 INTERPRETATION
🟥 Red Lines: Previous highs, representing buy-side liquidity (potential stop hunts above).
🟦 Blue Lines: Previous lows, representing sell-side liquidity.
🟢 Candle Color Change: Visualizes shifts in short-term momentum relative to previous close.
These levels help traders spot where liquidity sweeps may occur — a key concept in institutional trading and SMC methodology.
⚙️ CUSTOMIZATION
Adjust bar sensitivity to detect major or minor structures
Modify line color, style, and thickness
Toggle swing labels and liquidity visualization
Control candle color behavior (body, border, wick)
🔶 CONCLUSION
We believe that success lies in the association of the user with the indicator, opposed to many traders who have the perspective that the indicator itself can make them become profitable. The reality is much more complicated than that. The aim is to provide an indicator comprehensive, customizable, and intuitive enough that any trader can be led to understand this truth and develop an actionable perspective of technical indicators as support tools for decision making. You can see the Author's instructions below to get instant access to this indicator
🔶 RISK DISCLAIMER
Trading is risky & most day traders lose money. All content, tools, scripts, articles, & education provided by ZynAlgo are purely for informational & educational purposes only. Past performance does not guarantee future results.
The indicator dynamically draws and updates these levels in real time, providing traders with an instant map of market structure — where price is most likely to react, reverse, or break through.
It’s built for traders who rely on structure-based trading, smart money concepts (SMC), and liquidity-based analysis, offering a clean, efficient, and objective way to view market levels without manual charting.
⚙️ CORE CONCEPT
Markets move through cycles of liquidity — sweeping previous highs and lows before establishing new structure.
S&R Pro captures these key points automatically, creating clear horizontal levels that represent potential liquidity zones and high-probability reaction areas.
Every zone is drawn dynamically using confirmed swing highs and lows, ensuring that the indicator adapts to evolving price action while keeping your charts clean and uncluttered.
🧩 FEATURES
Automatic Detection of swing highs/lows based on user-defined sensitivity
Liquidity Pool Visualization for both buy-side and sell-side zones
Dynamic Extension Lines that update until new structure forms
Customizable Styling: color, line width, and line type
Candle Coloring System to enhance visual clarity of price action
Smart Alerts for liquidity sweeps and swing confirmations
Lightweight & Fast Rendering — optimized for all market types
🧠 HOW TO USE
Add the indicator to your chart and adjust “Left/Right Bar” to control how sensitive swing detection is.
Liquidity lines (red for buy-side, blue for sell-side) will automatically appear and extend until new structure is formed.
Watch how price interacts with these lines — reactions often occur near recent liquidity zones.
Combine with your existing confluence tools such as trend dashboards or volume filters to refine entries and exits.
Set alerts for when liquidity zones are reached or when new swing points form.
📊 INTERPRETATION
🟥 Red Lines: Previous highs, representing buy-side liquidity (potential stop hunts above).
🟦 Blue Lines: Previous lows, representing sell-side liquidity.
🟢 Candle Color Change: Visualizes shifts in short-term momentum relative to previous close.
These levels help traders spot where liquidity sweeps may occur — a key concept in institutional trading and SMC methodology.
⚙️ CUSTOMIZATION
Adjust bar sensitivity to detect major or minor structures
Modify line color, style, and thickness
Toggle swing labels and liquidity visualization
Control candle color behavior (body, border, wick)
🔶 CONCLUSION
We believe that success lies in the association of the user with the indicator, opposed to many traders who have the perspective that the indicator itself can make them become profitable. The reality is much more complicated than that. The aim is to provide an indicator comprehensive, customizable, and intuitive enough that any trader can be led to understand this truth and develop an actionable perspective of technical indicators as support tools for decision making. You can see the Author's instructions below to get instant access to this indicator
🔶 RISK DISCLAIMER
Trading is risky & most day traders lose money. All content, tools, scripts, articles, & education provided by ZynAlgo are purely for informational & educational purposes only. Past performance does not guarantee future results.
招待専用スクリプト
こちらのスクリプトにアクセスできるのは投稿者が承認したユーザーだけです。投稿者にリクエストして使用許可を得る必要があります。通常の場合、支払い後に許可されます。詳細については、以下、作者の指示をお読みになるか、ZynAlgoに直接ご連絡ください。
スクリプトの機能を理解し、その作者を全面的に信頼しているのでなければ、お金を支払ってまでそのスクリプトを利用することをTradingViewとしては「非推奨」としています。コミュニティスクリプトの中で、その代わりとなる無料かつオープンソースのスクリプトを見つけられる可能性もあります。
作者の指示
To request access, please contact the author privately via TradingView direct message.
Do not request access in the Comments section.
免責事項
これらの情報および投稿は、TradingViewが提供または保証する金融、投資、取引、またはその他の種類のアドバイスや推奨を意図したものではなく、またそのようなものでもありません。詳しくは利用規約をご覧ください。