OPEN-SOURCE SCRIPT
更新済 Initial Balance

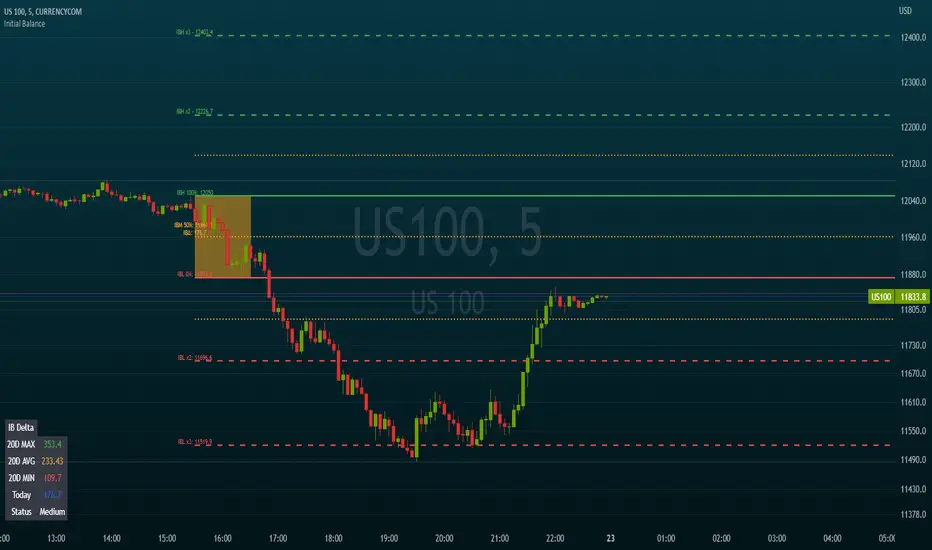
This script calculates and draws the initial balance price levels which can be really interesting for intraday activities.
Note: Obviously, you need to wait for the calculation period to finish in order to see your daily levels
The tool includes the following options
Note: Obviously, you need to wait for the calculation period to finish in order to see your daily levels
The tool includes the following options
- Customization of the session used to calculate the initial balance (default 0930-1030)
- Show/Hide the calculation period (as a background color)
- Show/Hide extra levels (report the IBH-IBL delta above and under the IB area)
- Show/Hide intermediate levels (displays 50% price levels in the IB and extra areas)
- Show labels (Display levels names as well as their price on corresponding lines)
Levels names:
- IBH (Initial Balance High)
- IBH (Initial Balance Low)
- IBM (Initial Balance Middle)
- IBH x2
- IBL x2 - Default colors are green for high levels, red for low levels, and orange for intermediate levels
- Extend levels (extends the current levels to left/right/both/none sides of the chart)
リリースノート
Note : Must be used under 30min timeframe (included)- max_bars_back parameter added
- Tiny bug counting an unnecessary candle above 1m charts
リリースノート
Updates- default High and Low colors are now inverted
- 3rd H/L levels added
- High/Low delta of the initial balance is now displayed next to the IBM level
リリースノート
Updates:- The IB area is now colored to keep an easy view of a potential current trend formed through previous days (can be disabled)
- Line style for main/extended/intermediate levels can be modified
リリースノート
Update- IB of previous days is disabled by default
- IB calculation period background disabled by default
リリースノート
Update- Labels size can be modified in options
リリースノート
Update:A few weeks ago, I wanted to have an quick synthesis of the current initial balance size compared to previous days, so I implemented a screener comparing the current IB delta with Min/Max/Avg delta of the 20 previous sessions to easily determine a Small/Medium/Huge status.
オープンソーススクリプト
TradingViewの精神に則り、このスクリプトの作者はコードをオープンソースとして公開してくれました。トレーダーが内容を確認・検証できるようにという配慮です。作者に拍手を送りましょう!無料で利用できますが、コードの再公開はハウスルールに従う必要があります。
免責事項
この情報および投稿は、TradingViewが提供または推奨する金融、投資、トレード、その他のアドバイスや推奨を意図するものではなく、それらを構成するものでもありません。詳細は利用規約をご覧ください。
オープンソーススクリプト
TradingViewの精神に則り、このスクリプトの作者はコードをオープンソースとして公開してくれました。トレーダーが内容を確認・検証できるようにという配慮です。作者に拍手を送りましょう!無料で利用できますが、コードの再公開はハウスルールに従う必要があります。
免責事項
この情報および投稿は、TradingViewが提供または推奨する金融、投資、トレード、その他のアドバイスや推奨を意図するものではなく、それらを構成するものでもありません。詳細は利用規約をご覧ください。