INVITE-ONLY SCRIPT
更新済 Continuation Opportunity with MTF Screener by QTX Algo Systems
Continuation Opportunity Indicator with MTF Screener by QTX Algo Systems
Overview
This enhanced indicator is designed to pinpoint key moments when an established trend is likely to continue. By combining traditional momentum analysis with dual volatility measures—and now integrating a powerful Multi Time Frame (MTF) Screener—it offers a multi-dimensional view of trend behavior. This tool not only detects when a pullback is simply a temporary consolidation (characterized by reduced volatility) but also confirms that the overall trend is poised to resume, validated across several timeframes.
How It Works
Core Methodology:
The base indicator uses a double‐smoothed Stochastic Momentum Index (SMI) combined with a Price – Moving Average Ratio (PMARP) to detect momentum crossovers that signal trend continuation. It also uses volatility filters to ensure that the signals occur only when market activity is strong.
Dual Volatility Analysis:
A Bollinger Band Width Percentile (BBWP) measure and historical volatility metrics work together to ensure that only meaningful pullbacks trigger signals—distinguishing between noise and genuine consolidation.
MTF Screener Integration:
The new MTF Screener feature extends the analysis beyond a single timeframe. It scans multiple assets and timeframes concurrently, confirming that a detected pullback or resumption signal appears consistently across the broader market view. This cross-verification minimizes false signals and provides traders with confidence that the trend continuation is robust.
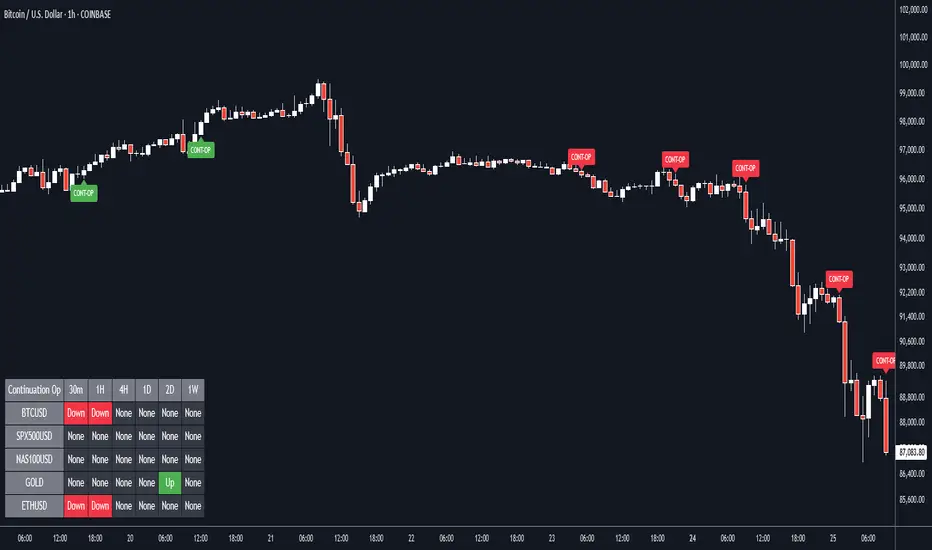
Enhanced Visual Cues:
Color-coded backgrounds and well-defined signal triggers help traders quickly interpret when a pullback is likely just a consolidation phase and when increased volatility signals the trend’s resumption.
Why It’s Different and Valuable
Unlike a simple combination of separate indicators, this tool integrates each element in a systematic, layered approach. The MTF Screener adds an extra dimension by validating signals across different timeframes—ensuring that traders are not basing decisions on isolated, potentially misleading data. This cohesive design enhances overall accuracy and provides actionable insights that are more robust than what individual indicators would offer on their own.
How to Use
Monitor Visual Signals: Look for color-coded cues and momentum crossovers that appear after a pullback.
Validate Across Timeframes: Use the MTF Screener’s output to confirm that the continuation signal is consistent across various timeframes.
Integrate with Other Tools: Combine these signals with your existing technical analysis methods to refine your entry and exit points.
Disclaimer
This indicator is provided for educational purposes only and is intended to support your trading analysis. It does not guarantee performance, and past results are not indicative of future outcomes. Always use proper risk management and perform your own analysis before trading.
Overview
This enhanced indicator is designed to pinpoint key moments when an established trend is likely to continue. By combining traditional momentum analysis with dual volatility measures—and now integrating a powerful Multi Time Frame (MTF) Screener—it offers a multi-dimensional view of trend behavior. This tool not only detects when a pullback is simply a temporary consolidation (characterized by reduced volatility) but also confirms that the overall trend is poised to resume, validated across several timeframes.
How It Works
Core Methodology:
The base indicator uses a double‐smoothed Stochastic Momentum Index (SMI) combined with a Price – Moving Average Ratio (PMARP) to detect momentum crossovers that signal trend continuation. It also uses volatility filters to ensure that the signals occur only when market activity is strong.
Dual Volatility Analysis:
A Bollinger Band Width Percentile (BBWP) measure and historical volatility metrics work together to ensure that only meaningful pullbacks trigger signals—distinguishing between noise and genuine consolidation.
MTF Screener Integration:
The new MTF Screener feature extends the analysis beyond a single timeframe. It scans multiple assets and timeframes concurrently, confirming that a detected pullback or resumption signal appears consistently across the broader market view. This cross-verification minimizes false signals and provides traders with confidence that the trend continuation is robust.
Enhanced Visual Cues:
Color-coded backgrounds and well-defined signal triggers help traders quickly interpret when a pullback is likely just a consolidation phase and when increased volatility signals the trend’s resumption.
Why It’s Different and Valuable
Unlike a simple combination of separate indicators, this tool integrates each element in a systematic, layered approach. The MTF Screener adds an extra dimension by validating signals across different timeframes—ensuring that traders are not basing decisions on isolated, potentially misleading data. This cohesive design enhances overall accuracy and provides actionable insights that are more robust than what individual indicators would offer on their own.
How to Use
Monitor Visual Signals: Look for color-coded cues and momentum crossovers that appear after a pullback.
Validate Across Timeframes: Use the MTF Screener’s output to confirm that the continuation signal is consistent across various timeframes.
Integrate with Other Tools: Combine these signals with your existing technical analysis methods to refine your entry and exit points.
Disclaimer
This indicator is provided for educational purposes only and is intended to support your trading analysis. It does not guarantee performance, and past results are not indicative of future outcomes. Always use proper risk management and perform your own analysis before trading.
リリースノート
Continuation Opportunity Indicator with MTF Screener by QTX Algo SystemsOverview
This enhanced indicator is designed to pinpoint key moments when an established trend is likely to continue. By combining traditional momentum analysis with dual volatility measures—and now integrating a powerful Multi Time Frame (MTF) Screener—it offers a multi-dimensional view of trend behavior. This tool not only detects when a pullback is simply a temporary consolidation (characterized by reduced volatility) but also confirms that the overall trend is poised to resume, validated across several timeframes.
How It Works
Core Methodology:
The base indicator uses a double‐smoothed Stochastic Momentum Index (SMI) combined with a Price – Moving Average Ratio (PMARP) to detect momentum crossovers that signal trend continuation. It also uses volatility filters to ensure that the signals occur only when market activity is strong.
Dual Volatility Analysis:
A Bollinger Band Width Percentile (BBWP) measure and historical volatility metrics work together to ensure that only meaningful pullbacks trigger signals—distinguishing between noise and genuine consolidation.
MTF Screener Integration:
The new MTF Screener feature extends the analysis beyond a single timeframe. It scans multiple assets and timeframes concurrently, confirming that a detected pullback or resumption signal appears consistently across the broader market view. This cross-verification minimizes false signals and provides traders with confidence that the trend continuation is robust.
Enhanced Visual Cues:
Color-coded backgrounds and well-defined signal triggers help traders quickly interpret when a pullback is likely just a consolidation phase and when increased volatility signals the trend’s resumption.
Why It’s Different and Valuable
Unlike a simple combination of separate indicators, this tool integrates each element in a systematic, layered approach. The MTF Screener adds an extra dimension by validating signals across different timeframes—ensuring that traders are not basing decisions on isolated, potentially misleading data. This cohesive design enhances overall accuracy and provides actionable insights that are more robust than what individual indicators would offer on their own.
How to Use
Monitor Visual Signals: Look for color-coded cues and momentum crossovers that appear after a pullback.
Validate Across Timeframes: Use the MTF Screener’s output to confirm that the continuation signal is consistent across various timeframes.
Integrate with Other Tools: Combine these signals with your existing technical analysis methods to refine your entry and exit points.
Disclaimer
This indicator is provided for educational purposes only and is intended to support your trading analysis. It does not guarantee performance, and past results are not indicative of future outcomes. Always use proper risk management and perform your own analysis before trading.
リリースノート
We have added extra timeframes to the MTF Screener so users can now analyze very short term timeframes, and much longer timeframes also!招待専用スクリプト
このスクリプトは作者が承認したユーザーのみアクセス可能です。使用するにはアクセス申請をして許可を得る必要があります。通常は支払い後に承認されます。詳細は下記の作者の指示に従うか、QTXAlgoSystemsに直接お問い合わせください。
TradingViewは、作者を完全に信頼し、スクリプトの動作を理解していない限り、有料スクリプトの購入・使用を推奨しません。コミュニティスクリプトには無料のオープンソースの代替が多数あります。
作者の指示
If you would like access to this indicator, please contact QTX Algo Systems at contact@qtxalgosystems.com or visit qtxalgosystems.com
Contact us at contact@qtxalgosystems.com to access all of our tools and education or visit qtxalgosystems.com
免責事項
この情報および投稿は、TradingViewが提供または推奨する金融、投資、トレード、その他のアドバイスや推奨を意図するものではなく、それらを構成するものでもありません。詳細は利用規約をご覧ください。
招待専用スクリプト
このスクリプトは作者が承認したユーザーのみアクセス可能です。使用するにはアクセス申請をして許可を得る必要があります。通常は支払い後に承認されます。詳細は下記の作者の指示に従うか、QTXAlgoSystemsに直接お問い合わせください。
TradingViewは、作者を完全に信頼し、スクリプトの動作を理解していない限り、有料スクリプトの購入・使用を推奨しません。コミュニティスクリプトには無料のオープンソースの代替が多数あります。
作者の指示
If you would like access to this indicator, please contact QTX Algo Systems at contact@qtxalgosystems.com or visit qtxalgosystems.com
Contact us at contact@qtxalgosystems.com to access all of our tools and education or visit qtxalgosystems.com
免責事項
この情報および投稿は、TradingViewが提供または推奨する金融、投資、トレード、その他のアドバイスや推奨を意図するものではなく、それらを構成するものでもありません。詳細は利用規約をご覧ください。