INVITE-ONLY SCRIPT
Demand and Supply zone Master Indicator without Alert
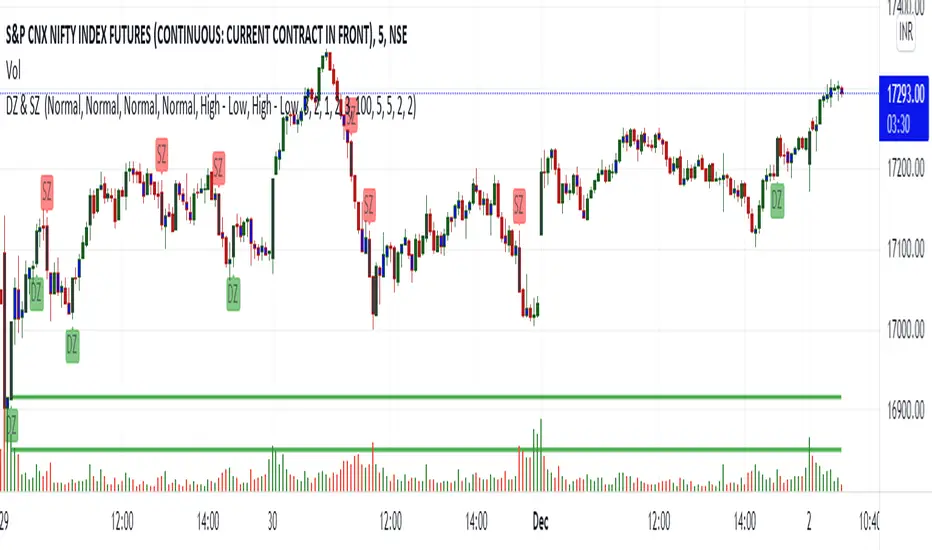
The Demand and Supply Zone indicator helps to identify the valid demand and supply zones by removing the played out zones. This indicator looks for all patterns , Rally-Base-Rally and Drop-Base-Rally mark the zone as "DZ". Same way with pattern Drop-Base-Drop and Rally-Base-Drop it will mark "SZ".
The indicator is fully customizable as per your trading style.
What does the Indicator do ?
Normal = Aggressive Trader
Strong = Conservative Trader
V Strong = V Conservative Trader
Based on Trading style one can choose the option available. Default gives the best result.
1. Explosive candle Range : One can choose explosive candle range.
2. Basing Candle Range : One Can Choose Basing candle range.
3. Normal Candle Range : One can choose the normal candle range.
4. Legout Strength : One can customize the Legout Strength.
5. Demand and Supply zone version :
High - Low = Most traders use the high and low of the basing for calculating their zone.
Body - Low = Body (Base candle body high for demand zone and Body low for supply zone ). Normally beginner ( Conservative trader ) uses this option.
Continuous base = 1 to 10 : Based on the requirement one can use the number of basing candle.
max normal = 2 to 10 : Based on the requirement one can use the number of normal candle.
min normal = 1 to 10 : Min one to form the zone.
Line width = 1 to 5
MaxTouches = One can set the number of times the price visits the zone. 1 for Conservative trader and 3 for aggressive trader. Once the price touches the zone more than the given input, lines get deleted. Also if the price is grater that the zone value, line deletes.
Bar Lookback = How many bars to look back to check the strength of the candle. Default gives the best result.
Max Demand and Supply zones and Show all active Demand and Supply zones = One can visually see played out ( violated ) zones by unticking the Active zones option.
MaxActiveDemand and Sell Zone : One can have max number of active Demand and Supply Zones on Chart. This option looks chart clean.
招待専用スクリプト
このスクリプトは作者が承認したユーザーのみアクセス可能です。使用するにはアクセス申請をして許可を得る必要があります。通常は支払い後に承認されます。詳細は下記の作者の指示に従うか、SupplyIsInDemandに直接お問い合わせください。
TradingViewは、作者を完全に信頼し、スクリプトの動作を理解していない限り、有料スクリプトの購入・使用を推奨しません。コミュニティスクリプトには無料のオープンソースの代替が多数あります。
作者の指示
Please DM us for trial access.
免責事項
この情報および投稿は、TradingViewが提供または推奨する金融、投資、トレード、その他のアドバイスや推奨を意図するものではなく、それらを構成するものでもありません。詳細は利用規約をご覧ください。