PROTECTED SOURCE SCRIPT
更新済 NEoWave Chart
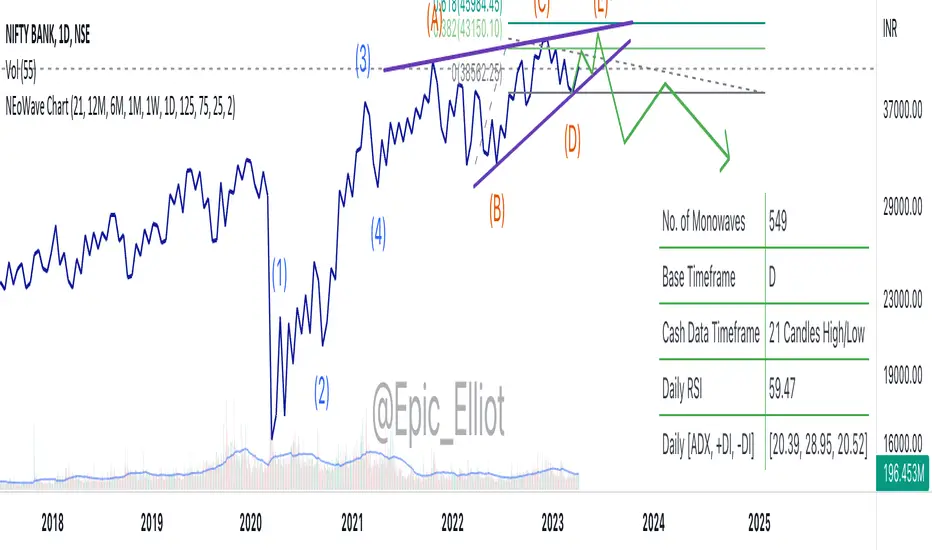
This is the indicator used to plot cash data chart for NEoWave analysis.
How to use:
How to use:
- Apply the indicator on the chart.
- Select timeframe on your chart.
- The indicator will automatically select default cash data timeframe and will plot chart accordingly. If you like to change the cash data timeframe, these is an option to select from dropdown.
リリースノート
I have added various features in this update like, selecting cash data timeframe based on number of candles or in-build timeframe, updated table content. Though, cash data chart based on in-built timeframe will work on certain timeframes only, as other timeframes does not equally divide.リリースノート
1 Cash data chart based on number of candles. Number of candles to be used for the chart may be selected from dropdown menu2 Cash data chart also available based on inbuilt timeframes, but limited to some specific timeframes only. Custom timeframe may be selected from dropdown menu.
3 Cash data timeframe divider included, may be selected/unselected in the menu.
4 First and last monowaves improved.
5 Candlestick chart also added. Transparency may be changed in the style menu.
リリースノート
RSI and ADX values based on daily timeframe added保護スクリプト
このスクリプトのソースコードは非公開で投稿されています。 ただし、制限なく自由に使用できます – 詳細はこちらでご確認ください。
免責事項
この情報および投稿は、TradingViewが提供または推奨する金融、投資、トレード、その他のアドバイスや推奨を意図するものではなく、それらを構成するものでもありません。詳細は利用規約をご覧ください。
保護スクリプト
このスクリプトのソースコードは非公開で投稿されています。 ただし、制限なく自由に使用できます – 詳細はこちらでご確認ください。
免責事項
この情報および投稿は、TradingViewが提供または推奨する金融、投資、トレード、その他のアドバイスや推奨を意図するものではなく、それらを構成するものでもありません。詳細は利用規約をご覧ください。