PROTECTED SOURCE SCRIPT
更新済 Financial Label
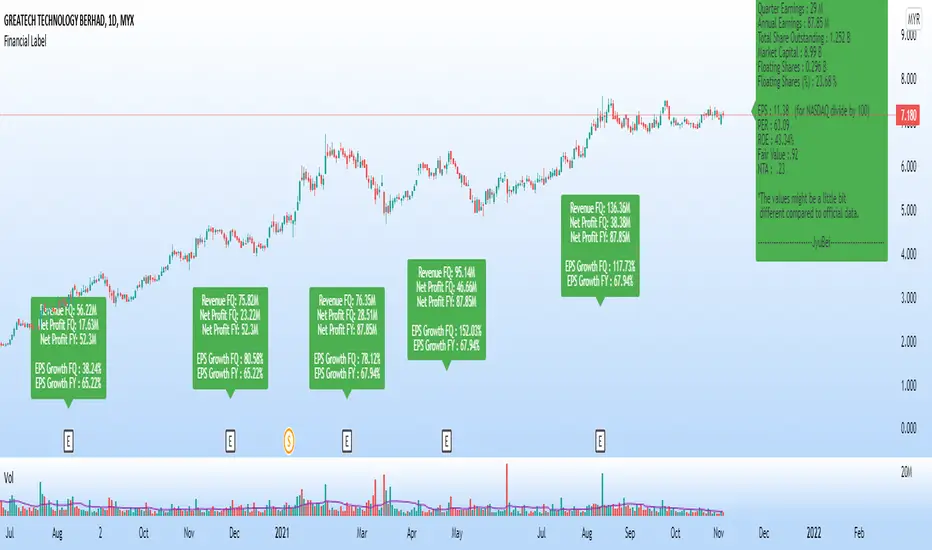
5 Magic Numbers, C, A & S (for CANSLIM) in 1 label.
This label shows:
1. Latest Quarter Earnings (QR)
2. Annual Earnings (AR)
3. Total Share Outstanding
4. Market Capital
5. Floating Shares
6. Earning per Share (EPS)
7. Price per Earning Ratio (P/E Ratio @ PER)
8. Return On Equity (ROE)
9. Fair Value (FV)
10. Non Tangible Asset (NTA)
This label will show the data only on charts that have financial data only.
Warrants, futures, crypto, etc. will not have any display on this label.
Suitable for all markets including US, Asia, Europe and others.
Thus, no currency symbol ($,¥,€, RM, etc.) will be displayed, only numbers.
Green label means EPS is positive - profitable company.
Red label means EPS is negative - loss making company.
Note:
1. The values might be a little bit different from official data, due to type of data taken & calculations, as we have a few formulas for each data.
2. Please confirm more accurate data from your trusted and official source of data.
リリースノート
Additional1. Floating share in percent (%)
2. Quarter Report (QR/FQ) data
i. Revenue FQ
ii. Net profit FQ
iii. Net profit FY
iv. EPS Growth FQ
v. EPS Growth FY
* If Net Profit is POSITIVE, the label will be in GREEN.
** If Net Profit is NEGATIVE, the label will be in RED.
Changes:
1. Earnings are in Million (M)
2. Shares are in Billion (B)
Note:
1. For US market, the EPS value need to divide by 100. This number is close to the values in finvis.com (my reference)
2. The values might be different from other source of data. Please use as quick reference, not main reference.
保護スクリプト
このスクリプトのソースコードは非公開で投稿されています。 ただし、制限なく自由に使用できます – 詳細はこちらでご確認ください。
免責事項
この情報および投稿は、TradingViewが提供または推奨する金融、投資、トレード、その他のアドバイスや推奨を意図するものではなく、それらを構成するものでもありません。詳細は利用規約をご覧ください。
免責事項
この情報および投稿は、TradingViewが提供または推奨する金融、投資、トレード、その他のアドバイスや推奨を意図するものではなく、それらを構成するものでもありません。詳細は利用規約をご覧ください。