PROTECTED SOURCE SCRIPT
更新済 Black Arrow
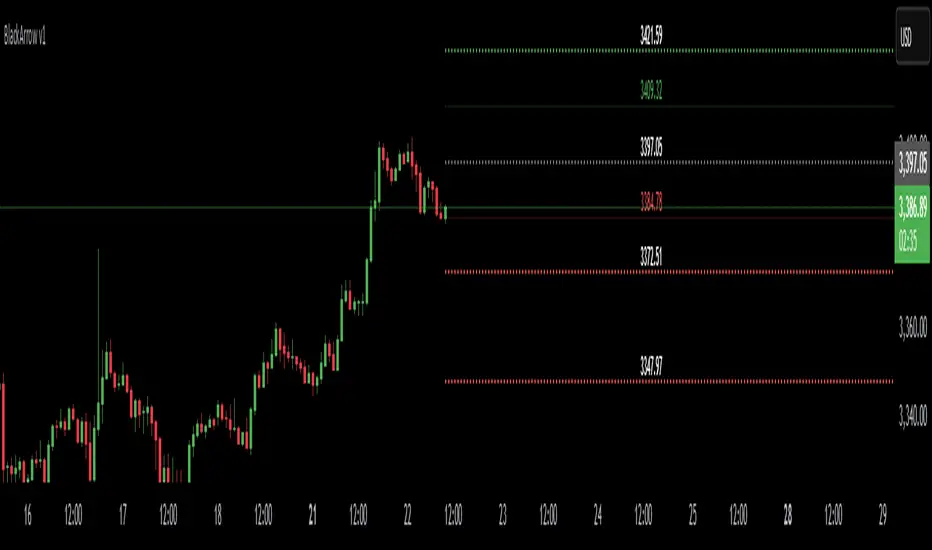
Expected Move Levels - Closer Prices
This script calculates and displays the expected move based on Implied Volatility (IV) and Days to Expiration (DTE). It helps traders visualize potential price movement ranges over a defined period using historical close price.
🔹 Key Features:
Customizable IV and DTE inputs
Displays 2 green levels above price and 2 red levels below, representing half and full expected move
Mid-lines between base price and first green/red level
Each level is labeled with its price value
Lines are drawn short and don't extend through the full chart for clarity
📘 Formula:
Expected Move = Price × IV × √(DTE / 365)
Use this tool to estimate market volatility zones and potential price targets without relying on traditional indicators.
リリースノート
..リリースノート
update保護スクリプト
このスクリプトのソースコードは非公開で投稿されています。 ただし、制限なく自由に使用できます – 詳細はこちらでご確認ください。
免責事項
この情報および投稿は、TradingViewが提供または推奨する金融、投資、トレード、その他のアドバイスや推奨を意図するものではなく、それらを構成するものでもありません。詳細は利用規約をご覧ください。
保護スクリプト
このスクリプトのソースコードは非公開で投稿されています。 ただし、制限なく自由に使用できます – 詳細はこちらでご確認ください。
免責事項
この情報および投稿は、TradingViewが提供または推奨する金融、投資、トレード、その他のアドバイスや推奨を意図するものではなく、それらを構成するものでもありません。詳細は利用規約をご覧ください。