PROTECTED SOURCE SCRIPT
更新済 Phase Pattern Detector v2
Phase Pattern Detector
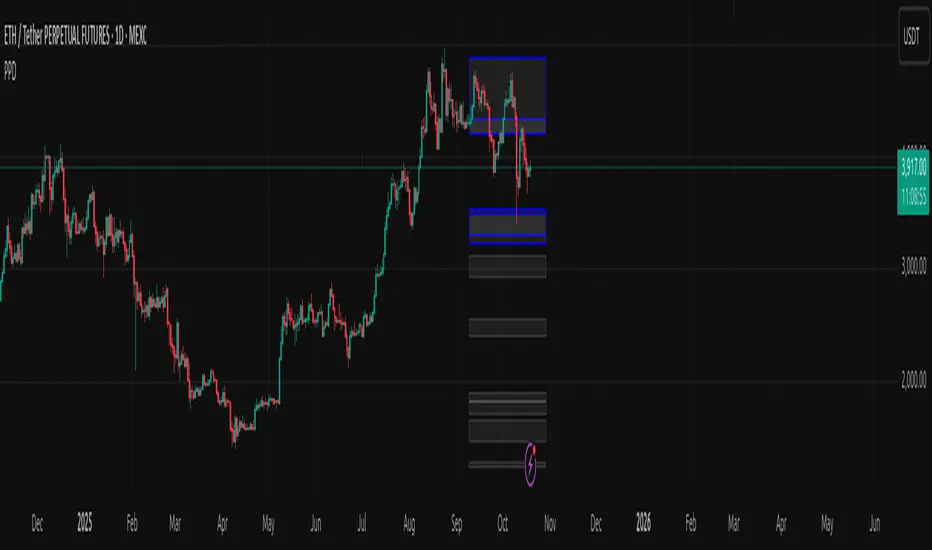
This indicator identifies and highlights structural price phases—areas where market behavior tends to repeat or shift. It visualizes the rhythm of price action rather than measuring momentum or volatility. Each phase is represented by visual zones that help traders recognize potential transitions between market states.
The tool does not provide buy or sell signals, nor does it predict future movement. It simply exposes patterns in price behavior to support analytical observation.
Users are solely responsible for any trading decisions made based on its visual cues. This indicator is meant for context and awareness, not for execution.
Always combine structural analysis with your own judgment, broader market context, and proper risk management.
リリースノート
Minör fixes保護スクリプト
このスクリプトのソースコードは非公開で投稿されています。 しかし、無料かつ制限なしでご利用いただけます ― 詳細についてはこちらをご覧ください。
免責事項
これらの情報および投稿は、TradingViewが提供または保証する金融、投資、取引、またはその他の種類のアドバイスや推奨を意図したものではなく、またそのようなものでもありません。詳しくは利用規約をご覧ください。
保護スクリプト
このスクリプトのソースコードは非公開で投稿されています。 しかし、無料かつ制限なしでご利用いただけます ― 詳細についてはこちらをご覧ください。
免責事項
これらの情報および投稿は、TradingViewが提供または保証する金融、投資、取引、またはその他の種類のアドバイスや推奨を意図したものではなく、またそのようなものでもありません。詳しくは利用規約をご覧ください。