INVITE-ONLY SCRIPT
Trends
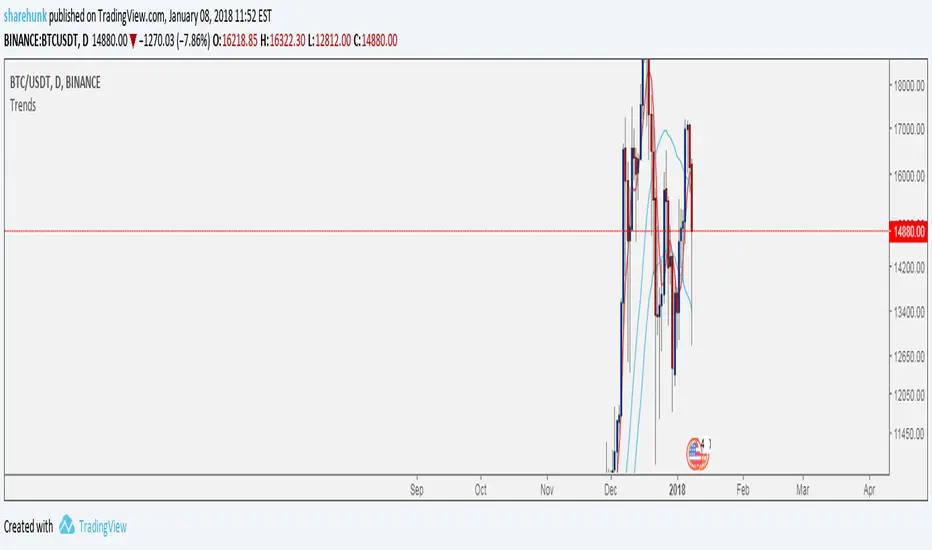
This chart will allow users to have a guide line for trading any markets by utilizing the below strategy.
a) For an up trending market [ Price is above the RED line and the RED line is above the two BLUE lines ]
A good BUY is when price reaches/drops near the RED line.
b) For a down trending market [ RED line is above the price and the two BLUE lines are above the RED line ]
A good SELL is when the price rises to the RED line.
Keeping it Simple !
Disclaimer : Trading involves risk, this script/strategy is not trading advise, rather it can act as a tool among others to gain confidence to enter a trade.
招待専用スクリプト
このスクリプトは作者が承認したユーザーのみアクセス可能です。使用するにはアクセス申請をして許可を得る必要があります。通常は支払い後に承認されます。詳細は下記の作者の指示に従うか、sharehunkに直接お問い合わせください。
TradingViewは、作者を完全に信頼し、スクリプトの動作を理解していない限り、有料スクリプトの購入・使用を推奨しません。コミュニティスクリプトには無料のオープンソースの代替が多数あります。
作者の指示
免責事項
この情報および投稿は、TradingViewが提供または推奨する金融、投資、トレード、その他のアドバイスや推奨を意図するものではなく、それらを構成するものでもありません。詳細は利用規約をご覧ください。