PROTECTED SOURCE SCRIPT
EMAS Signal DX
Hello all,
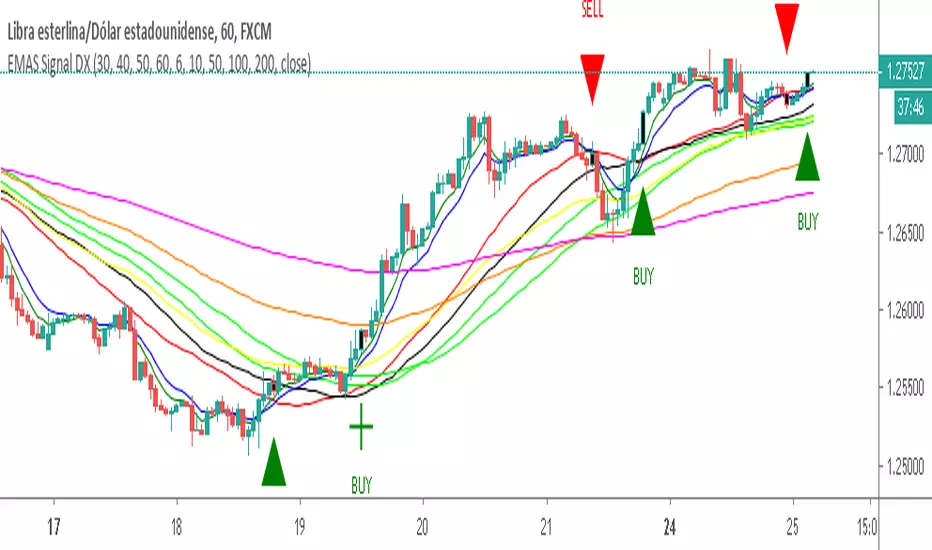
Vs2 of EMAS Signal Double Cross indicator that plots 5 EMA lines and 4 SMA .
Features:
-Signals are represented visually as a triangle on the chart.
-Also represented visually as bar color on the chart.
-When SMA and EMA 1 cross - a Long signal is called if SMA cross above EMA 1, a short if the cross is below EMA 1.
-When EMA 2 and EMA 3 cross - a Long signal is called if EMA 2 cross above EMA 3, a short if the cross is below EMA 3.
-You can activate and deactivate the triangles and the color of the bars.
That’s it, happy pips!
保護スクリプト
このスクリプトのソースコードは非公開で投稿されています。 ただし、制限なく自由に使用できます – 詳細はこちらでご確認ください。
免責事項
この情報および投稿は、TradingViewが提供または推奨する金融、投資、トレード、その他のアドバイスや推奨を意図するものではなく、それらを構成するものでもありません。詳細は利用規約をご覧ください。
免責事項
この情報および投稿は、TradingViewが提供または推奨する金融、投資、トレード、その他のアドバイスや推奨を意図するものではなく、それらを構成するものでもありません。詳細は利用規約をご覧ください。