PROTECTED SOURCE SCRIPT
1k TICK arrows
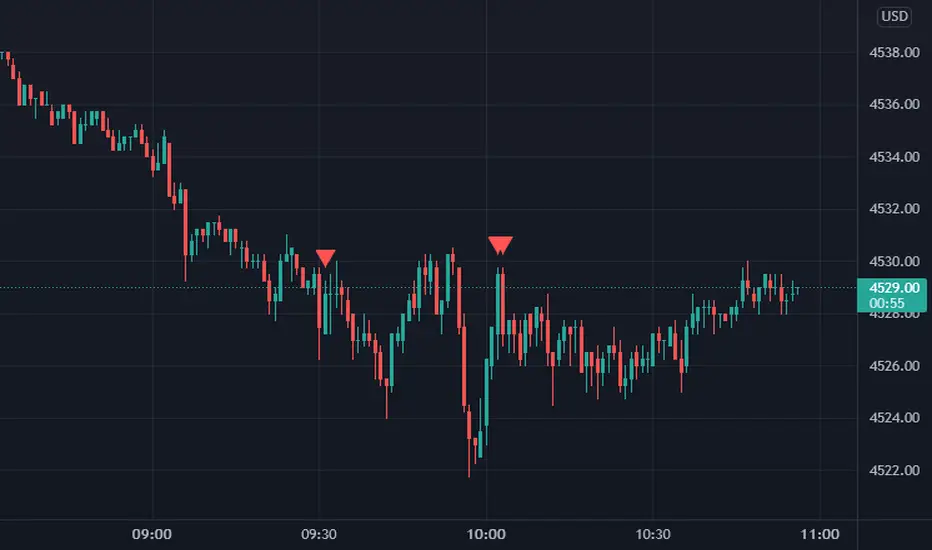
This plots green up arrows when the TICK index goes to -1,000 or lower or red down arrows when the TICK index goes +1,000 or higher. Can be used as a short term reversal signal (not investment advice). Will unfortunately plot on all charts but should only be relevant for US equity indices, mainly S&P500/ES futures. Indicator will adapt to the charts time frame and is hard coded to only show during 9:30-16:00 EST.
保護スクリプト
このスクリプトのソースコードは非公開で投稿されています。 ただし、制限なく自由に使用できます – 詳細はこちらでご確認ください。
免責事項
この情報および投稿は、TradingViewが提供または推奨する金融、投資、トレード、その他のアドバイスや推奨を意図するものではなく、それらを構成するものでもありません。詳細は利用規約をご覧ください。
保護スクリプト
このスクリプトのソースコードは非公開で投稿されています。 ただし、制限なく自由に使用できます – 詳細はこちらでご確認ください。
免責事項
この情報および投稿は、TradingViewが提供または推奨する金融、投資、トレード、その他のアドバイスや推奨を意図するものではなく、それらを構成するものでもありません。詳細は利用規約をご覧ください。