PROTECTED SOURCE SCRIPT
Z-Score Probability Indicator 2.0
Z-Score Probability Indicator 2.0 — by TanTechTrades™
See trend shifts before they’re obvious.
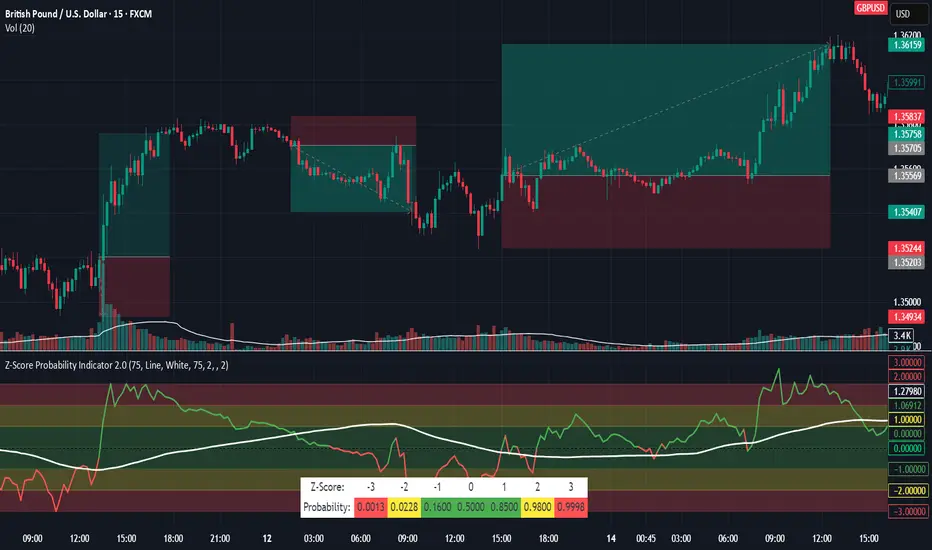
This upgraded Z-Score toolkit combines a more accurate Z-Score moving average (Z-SMA) with an optional classic SMA to separate noise from genuine regime changes. It maps price into standard-deviation space, highlights probability zones, and prints projected ±σ price levels—so you can judge where price sits in the distribution and how likely continuation or mean reversion is.
What it does
Z-Score of price (close, with optional candle view): Normalizes price relative to a rolling mean and volatility to show how extreme current levels are.
Z-SMA (trend backbone): A moving average of the Z-Score itself smooths the signal and helps confirm when a bias truly flips.
Probability bands (±1σ / ±2σ / ±3σ): Color-filled zones visualize where most observations tend to occur (green ≈ typical, yellow ≈ stretched, red ≈ statistically rare).
Projected price levels: Live labels print the price implied at 0, ±1σ, ±2σ, ±3σ using the chart’s SMA and standard deviation—handy for targets, fades, and risk framing.
Z-Table panel: A compact table shows your current Z bucket (−3 … +3) and reference probabilities at a glance.
Alert-ready regime logic: Optional alerts fire only when direction is aligned with the Z-SMA (e.g., line red and Z-SMA < 0).
How to read it
Line mode (default):
Green line above 0 → positive Z (price above its mean).
Red line below 0 → negative Z (price below its mean).
Bias confirmation: When Z-SMA crosses and holds above/below 0, the backdrop is shifting—not just wobbling.
Candle mode (optional): Renders Z-Score as candles (open/high/low/close in Z-space) to spot intrabar extremes vs. closes.
Distribution fills:
|Z| < 1 (green): typical noise / mean zone.
1 ≤ |Z| < 2 (yellow): stretched.
|Z| ≥ 2 (red): statistically rare—watch for either continuation in strong trends or snap-back risks.
Price labels (0/±1/±2/±3σ): Where price would be if it reverted to the mean or pushed to the next σ boundary—great for planning TPs/hedges.
Signals & Alerts
Green Line Alert (SMA Above 0): Z line is green and Z-SMA > 0 → pro-trend bullish context.
Red Line Alert (SMA Below 0): Z line is red and Z-SMA < 0 → pro-trend bearish context.
Use these to filter entries from your primary trigger (breakouts, pullbacks, momentum crosses, etc.).
Inputs (key settings)
Lookback Length (default 75): Window for Z-Score calc (mean & stdev).
Plot Type: Line (clean regime read) or Candles (intrabar Z detail).
SMA Length (default 75): Optional classic SMA length; reduce (e.g., 14) for responsiveness.
Distribution Probability Fills: Toggle zone shading.
Show Z-Table: On-chart Z bucket & reference probabilities.
Show SMA: Toggle the Z-SMA line.
Show SMA Standard Deviation Bands: Plots ±1σ around Z-SMA for added volatility context.
Round Target Prices Up or Down: Controls precision of the ±σ price labels.
Indicator Timeframe (Only Hourly presets): Override source timeframe (e.g., 30/60/120/240/360/720 mins).
Z-Score Line Width: Visual thickness for the main line.
Practical playbooks
Trend confirmation: Trade in the direction of the Z-SMA once it’s firmly above/below 0; use pullbacks toward 0Z as entries.
Mean-reversion fades: Look for exhaustion when Z pushes into ±2σ/±3σ zones against the Z-SMA direction.
Targets & risk: Use the projected ±σ price labels to set tiered TPs or stop placement aligned with current volatility.
Notes
Works on any symbol/timeframe; timeframe override lets you anchor to higher-timeframe hourly multiples while trading lower charts.
Z-Score is sensitive to volatility regime shifts; the Z-SMA smooths this and helps avoid whipsaw around 0.
Always pair with sound risk management; statistical “rarity” is not a guarantee of reversal.
TanTechTrades™ — turning probability into practical trading context.
See trend shifts before they’re obvious.
This upgraded Z-Score toolkit combines a more accurate Z-Score moving average (Z-SMA) with an optional classic SMA to separate noise from genuine regime changes. It maps price into standard-deviation space, highlights probability zones, and prints projected ±σ price levels—so you can judge where price sits in the distribution and how likely continuation or mean reversion is.
What it does
Z-Score of price (close, with optional candle view): Normalizes price relative to a rolling mean and volatility to show how extreme current levels are.
Z-SMA (trend backbone): A moving average of the Z-Score itself smooths the signal and helps confirm when a bias truly flips.
Probability bands (±1σ / ±2σ / ±3σ): Color-filled zones visualize where most observations tend to occur (green ≈ typical, yellow ≈ stretched, red ≈ statistically rare).
Projected price levels: Live labels print the price implied at 0, ±1σ, ±2σ, ±3σ using the chart’s SMA and standard deviation—handy for targets, fades, and risk framing.
Z-Table panel: A compact table shows your current Z bucket (−3 … +3) and reference probabilities at a glance.
Alert-ready regime logic: Optional alerts fire only when direction is aligned with the Z-SMA (e.g., line red and Z-SMA < 0).
How to read it
Line mode (default):
Green line above 0 → positive Z (price above its mean).
Red line below 0 → negative Z (price below its mean).
Bias confirmation: When Z-SMA crosses and holds above/below 0, the backdrop is shifting—not just wobbling.
Candle mode (optional): Renders Z-Score as candles (open/high/low/close in Z-space) to spot intrabar extremes vs. closes.
Distribution fills:
|Z| < 1 (green): typical noise / mean zone.
1 ≤ |Z| < 2 (yellow): stretched.
|Z| ≥ 2 (red): statistically rare—watch for either continuation in strong trends or snap-back risks.
Price labels (0/±1/±2/±3σ): Where price would be if it reverted to the mean or pushed to the next σ boundary—great for planning TPs/hedges.
Signals & Alerts
Green Line Alert (SMA Above 0): Z line is green and Z-SMA > 0 → pro-trend bullish context.
Red Line Alert (SMA Below 0): Z line is red and Z-SMA < 0 → pro-trend bearish context.
Use these to filter entries from your primary trigger (breakouts, pullbacks, momentum crosses, etc.).
Inputs (key settings)
Lookback Length (default 75): Window for Z-Score calc (mean & stdev).
Plot Type: Line (clean regime read) or Candles (intrabar Z detail).
SMA Length (default 75): Optional classic SMA length; reduce (e.g., 14) for responsiveness.
Distribution Probability Fills: Toggle zone shading.
Show Z-Table: On-chart Z bucket & reference probabilities.
Show SMA: Toggle the Z-SMA line.
Show SMA Standard Deviation Bands: Plots ±1σ around Z-SMA for added volatility context.
Round Target Prices Up or Down: Controls precision of the ±σ price labels.
Indicator Timeframe (Only Hourly presets): Override source timeframe (e.g., 30/60/120/240/360/720 mins).
Z-Score Line Width: Visual thickness for the main line.
Practical playbooks
Trend confirmation: Trade in the direction of the Z-SMA once it’s firmly above/below 0; use pullbacks toward 0Z as entries.
Mean-reversion fades: Look for exhaustion when Z pushes into ±2σ/±3σ zones against the Z-SMA direction.
Targets & risk: Use the projected ±σ price labels to set tiered TPs or stop placement aligned with current volatility.
Notes
Works on any symbol/timeframe; timeframe override lets you anchor to higher-timeframe hourly multiples while trading lower charts.
Z-Score is sensitive to volatility regime shifts; the Z-SMA smooths this and helps avoid whipsaw around 0.
Always pair with sound risk management; statistical “rarity” is not a guarantee of reversal.
TanTechTrades™ — turning probability into practical trading context.
保護スクリプト
このスクリプトのソースコードは非公開で投稿されています。 無料かつ制限なしでご利用いただけます ― 詳細についてはこちらをご覧ください。
免責事項
これらの情報および投稿は、TradingViewが提供または保証する金融、投資、取引、またはその他の種類のアドバイスや推奨を意図したものではなく、またそのようなものでもありません。詳しくは利用規約をご覧ください。
保護スクリプト
このスクリプトのソースコードは非公開で投稿されています。 無料かつ制限なしでご利用いただけます ― 詳細についてはこちらをご覧ください。
免責事項
これらの情報および投稿は、TradingViewが提供または保証する金融、投資、取引、またはその他の種類のアドバイスや推奨を意図したものではなく、またそのようなものでもありません。詳しくは利用規約をご覧ください。