PROTECTED SOURCE SCRIPT
Candle Range Theory - Higher-Timeframe Scanner
The CRT Range Scanner is a sophisticated trading tool that identifies potential Candle Range Theory (CRT) completions across multiple timeframes. Based on the Inner Circle Trader methodology, this indicator helps traders spot key market structure breaks and range expansions.
Key Features:
🔍 Higher-Timeframe Analysis: Automatically detects CRT patterns on higher timeframes while you trade on lower timeframes
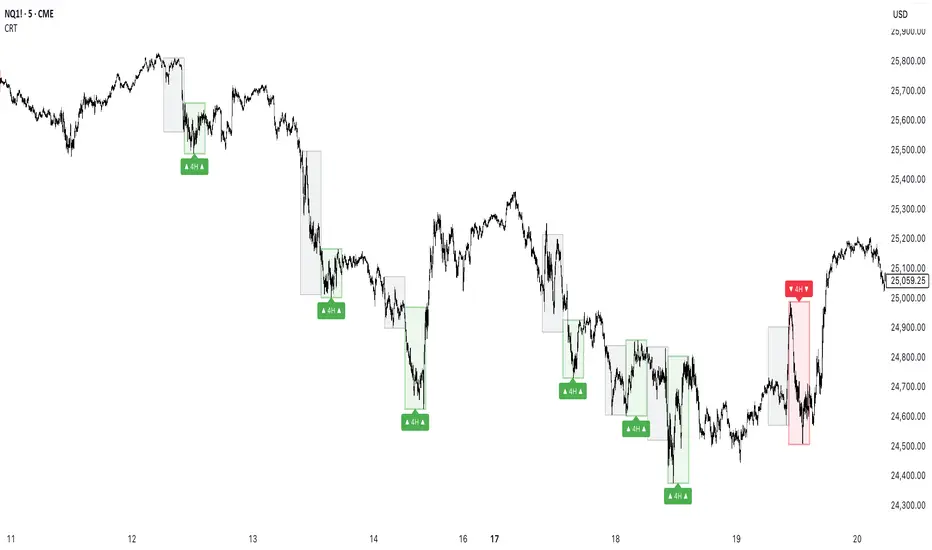
🎯 Bullish & Bearish CRT Signals: Identifies both bullish (range expansion to downside) and bearish (range expansion to upside) completions
⏰ Kill Zone Filtering: Customizable trading sessions to focus only on high-probability market hours
📊 Visual Range Boxes: Clear visual representation of current and previous higher timeframe ranges
🏷️ Smart Labeling: Timeframe-specific labels for easy pattern recognition
How It Works:
Bullish CRT: Occurs when price breaks below previous low during specific session times, indicating potential bullish reversal
Bearish CRT: Occurs when price breaks above previous high during specific session times, indicating potential bearish reversal
The indicator draws colored boxes around the relevant price ranges and provides clear visual cues for pattern recognition
Key Features:
🔍 Higher-Timeframe Analysis: Automatically detects CRT patterns on higher timeframes while you trade on lower timeframes
🎯 Bullish & Bearish CRT Signals: Identifies both bullish (range expansion to downside) and bearish (range expansion to upside) completions
⏰ Kill Zone Filtering: Customizable trading sessions to focus only on high-probability market hours
📊 Visual Range Boxes: Clear visual representation of current and previous higher timeframe ranges
🏷️ Smart Labeling: Timeframe-specific labels for easy pattern recognition
How It Works:
Bullish CRT: Occurs when price breaks below previous low during specific session times, indicating potential bullish reversal
Bearish CRT: Occurs when price breaks above previous high during specific session times, indicating potential bearish reversal
The indicator draws colored boxes around the relevant price ranges and provides clear visual cues for pattern recognition
保護スクリプト
このスクリプトのソースコードは非公開で投稿されています。 ただし、制限なく自由に使用できます – 詳細はこちらでご確認ください。
Luck Is What Happens When Preparation Meets Opportunity
免責事項
この情報および投稿は、TradingViewが提供または推奨する金融、投資、トレード、その他のアドバイスや推奨を意図するものではなく、それらを構成するものでもありません。詳細は利用規約をご覧ください。
保護スクリプト
このスクリプトのソースコードは非公開で投稿されています。 ただし、制限なく自由に使用できます – 詳細はこちらでご確認ください。
Luck Is What Happens When Preparation Meets Opportunity
免責事項
この情報および投稿は、TradingViewが提供または推奨する金融、投資、トレード、その他のアドバイスや推奨を意図するものではなく、それらを構成するものでもありません。詳細は利用規約をご覧ください。